Inspect, debug and profile your Avalonia apps
See inside your running app and fix issues where they happen. Community covers everyday inspection for free; Plus unlocks the full diagnostic toolkit for professional work.
Trusted by .NET teams around the world
Community edition
Everything you need to start inspecting your apps.
Whether you're evaluating Avalonia, learning the framework or building for fun, the Community edition covers everyday inspection of your desktop apps, free for non-commercial use.
Plus edition
Built for professional Avalonia development.
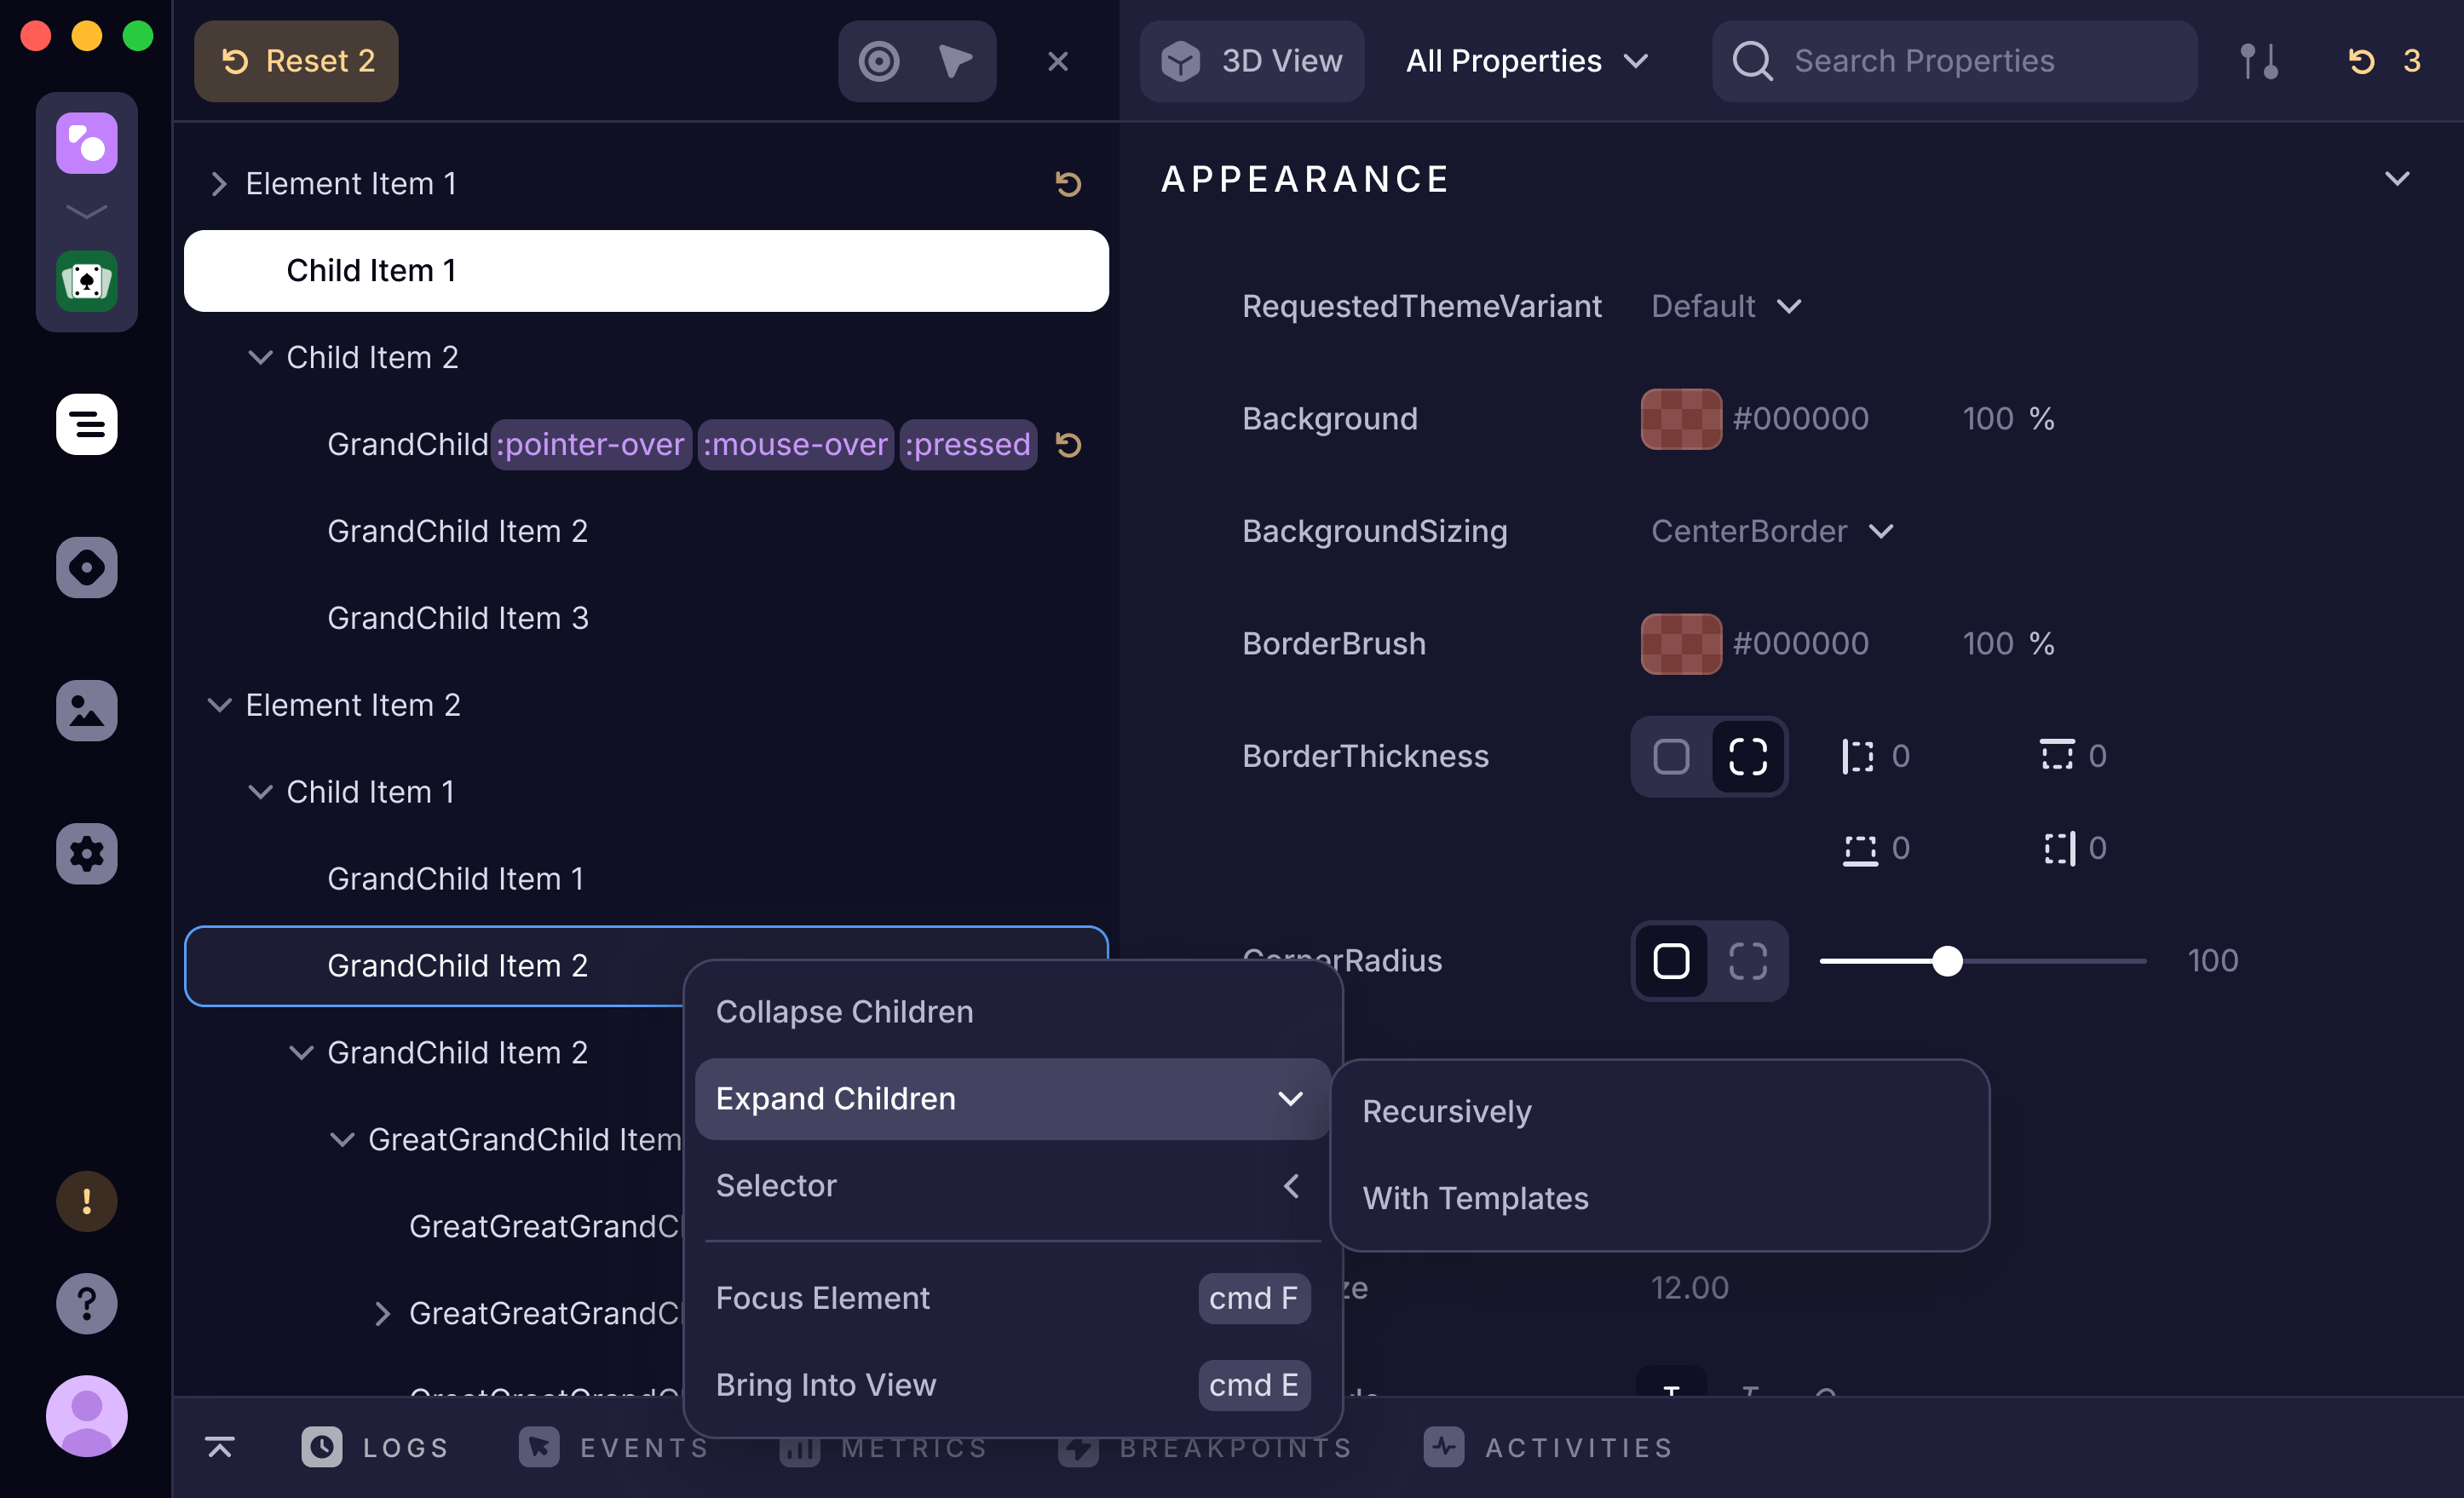
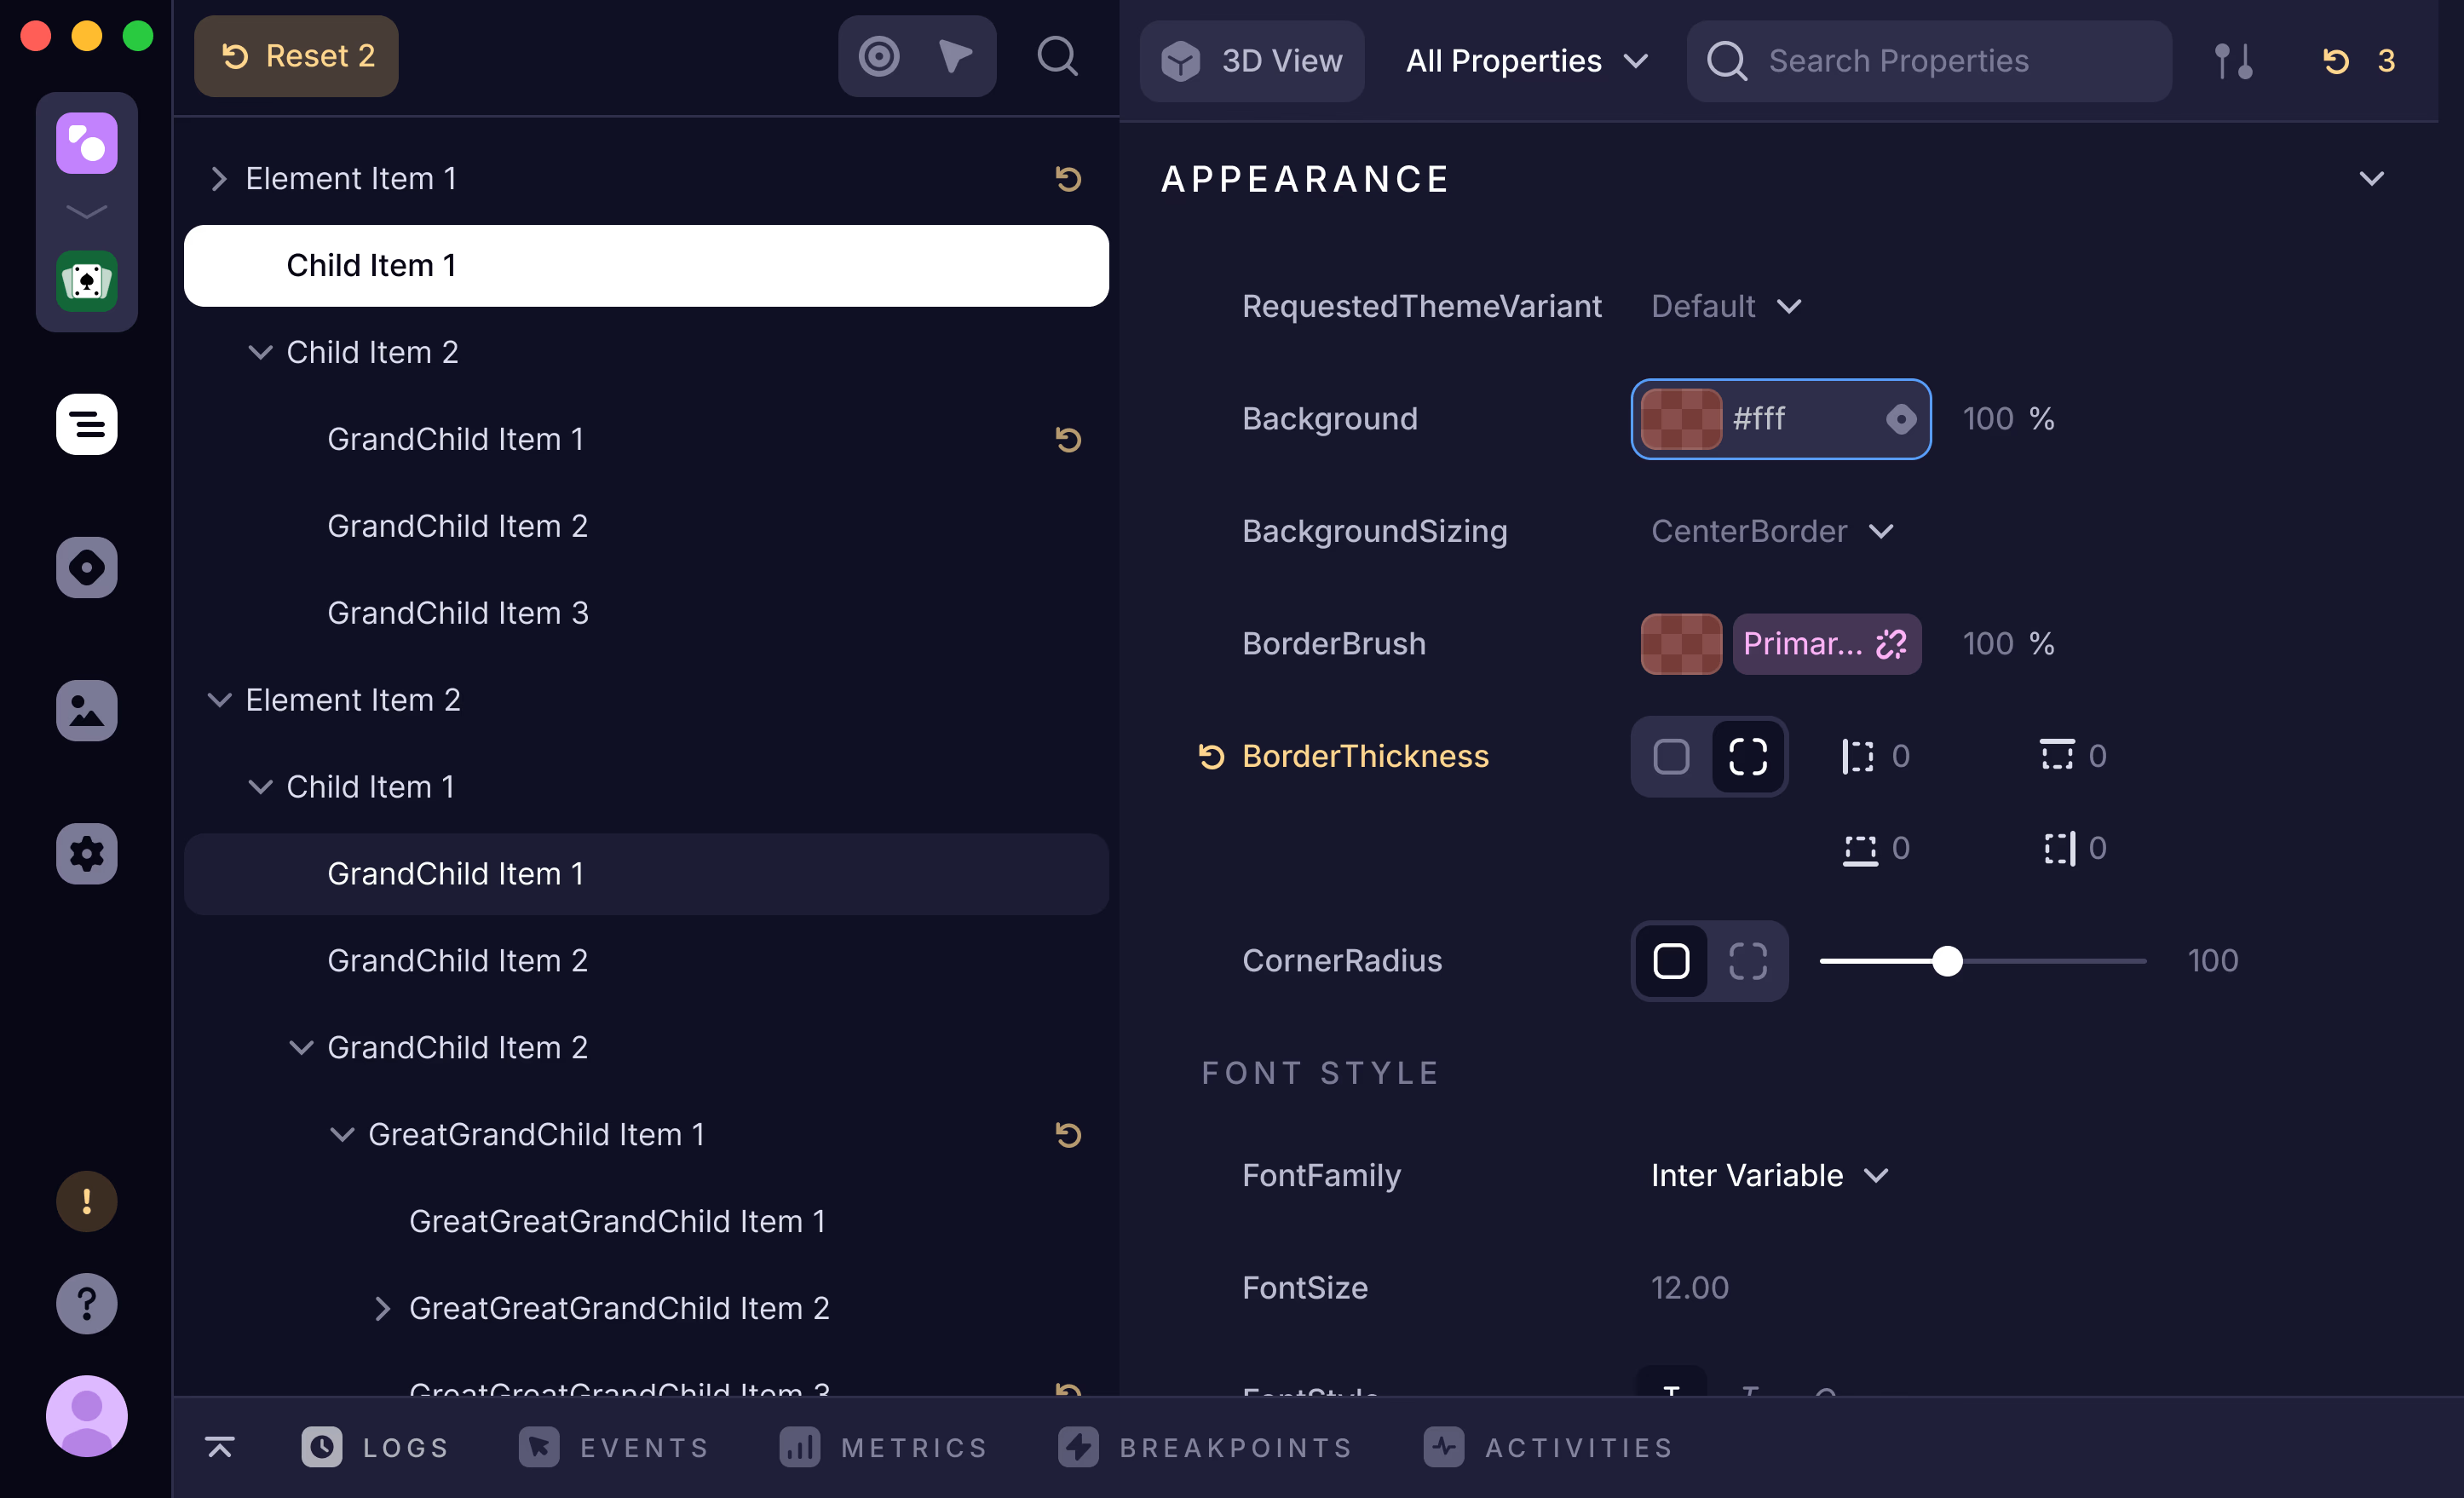
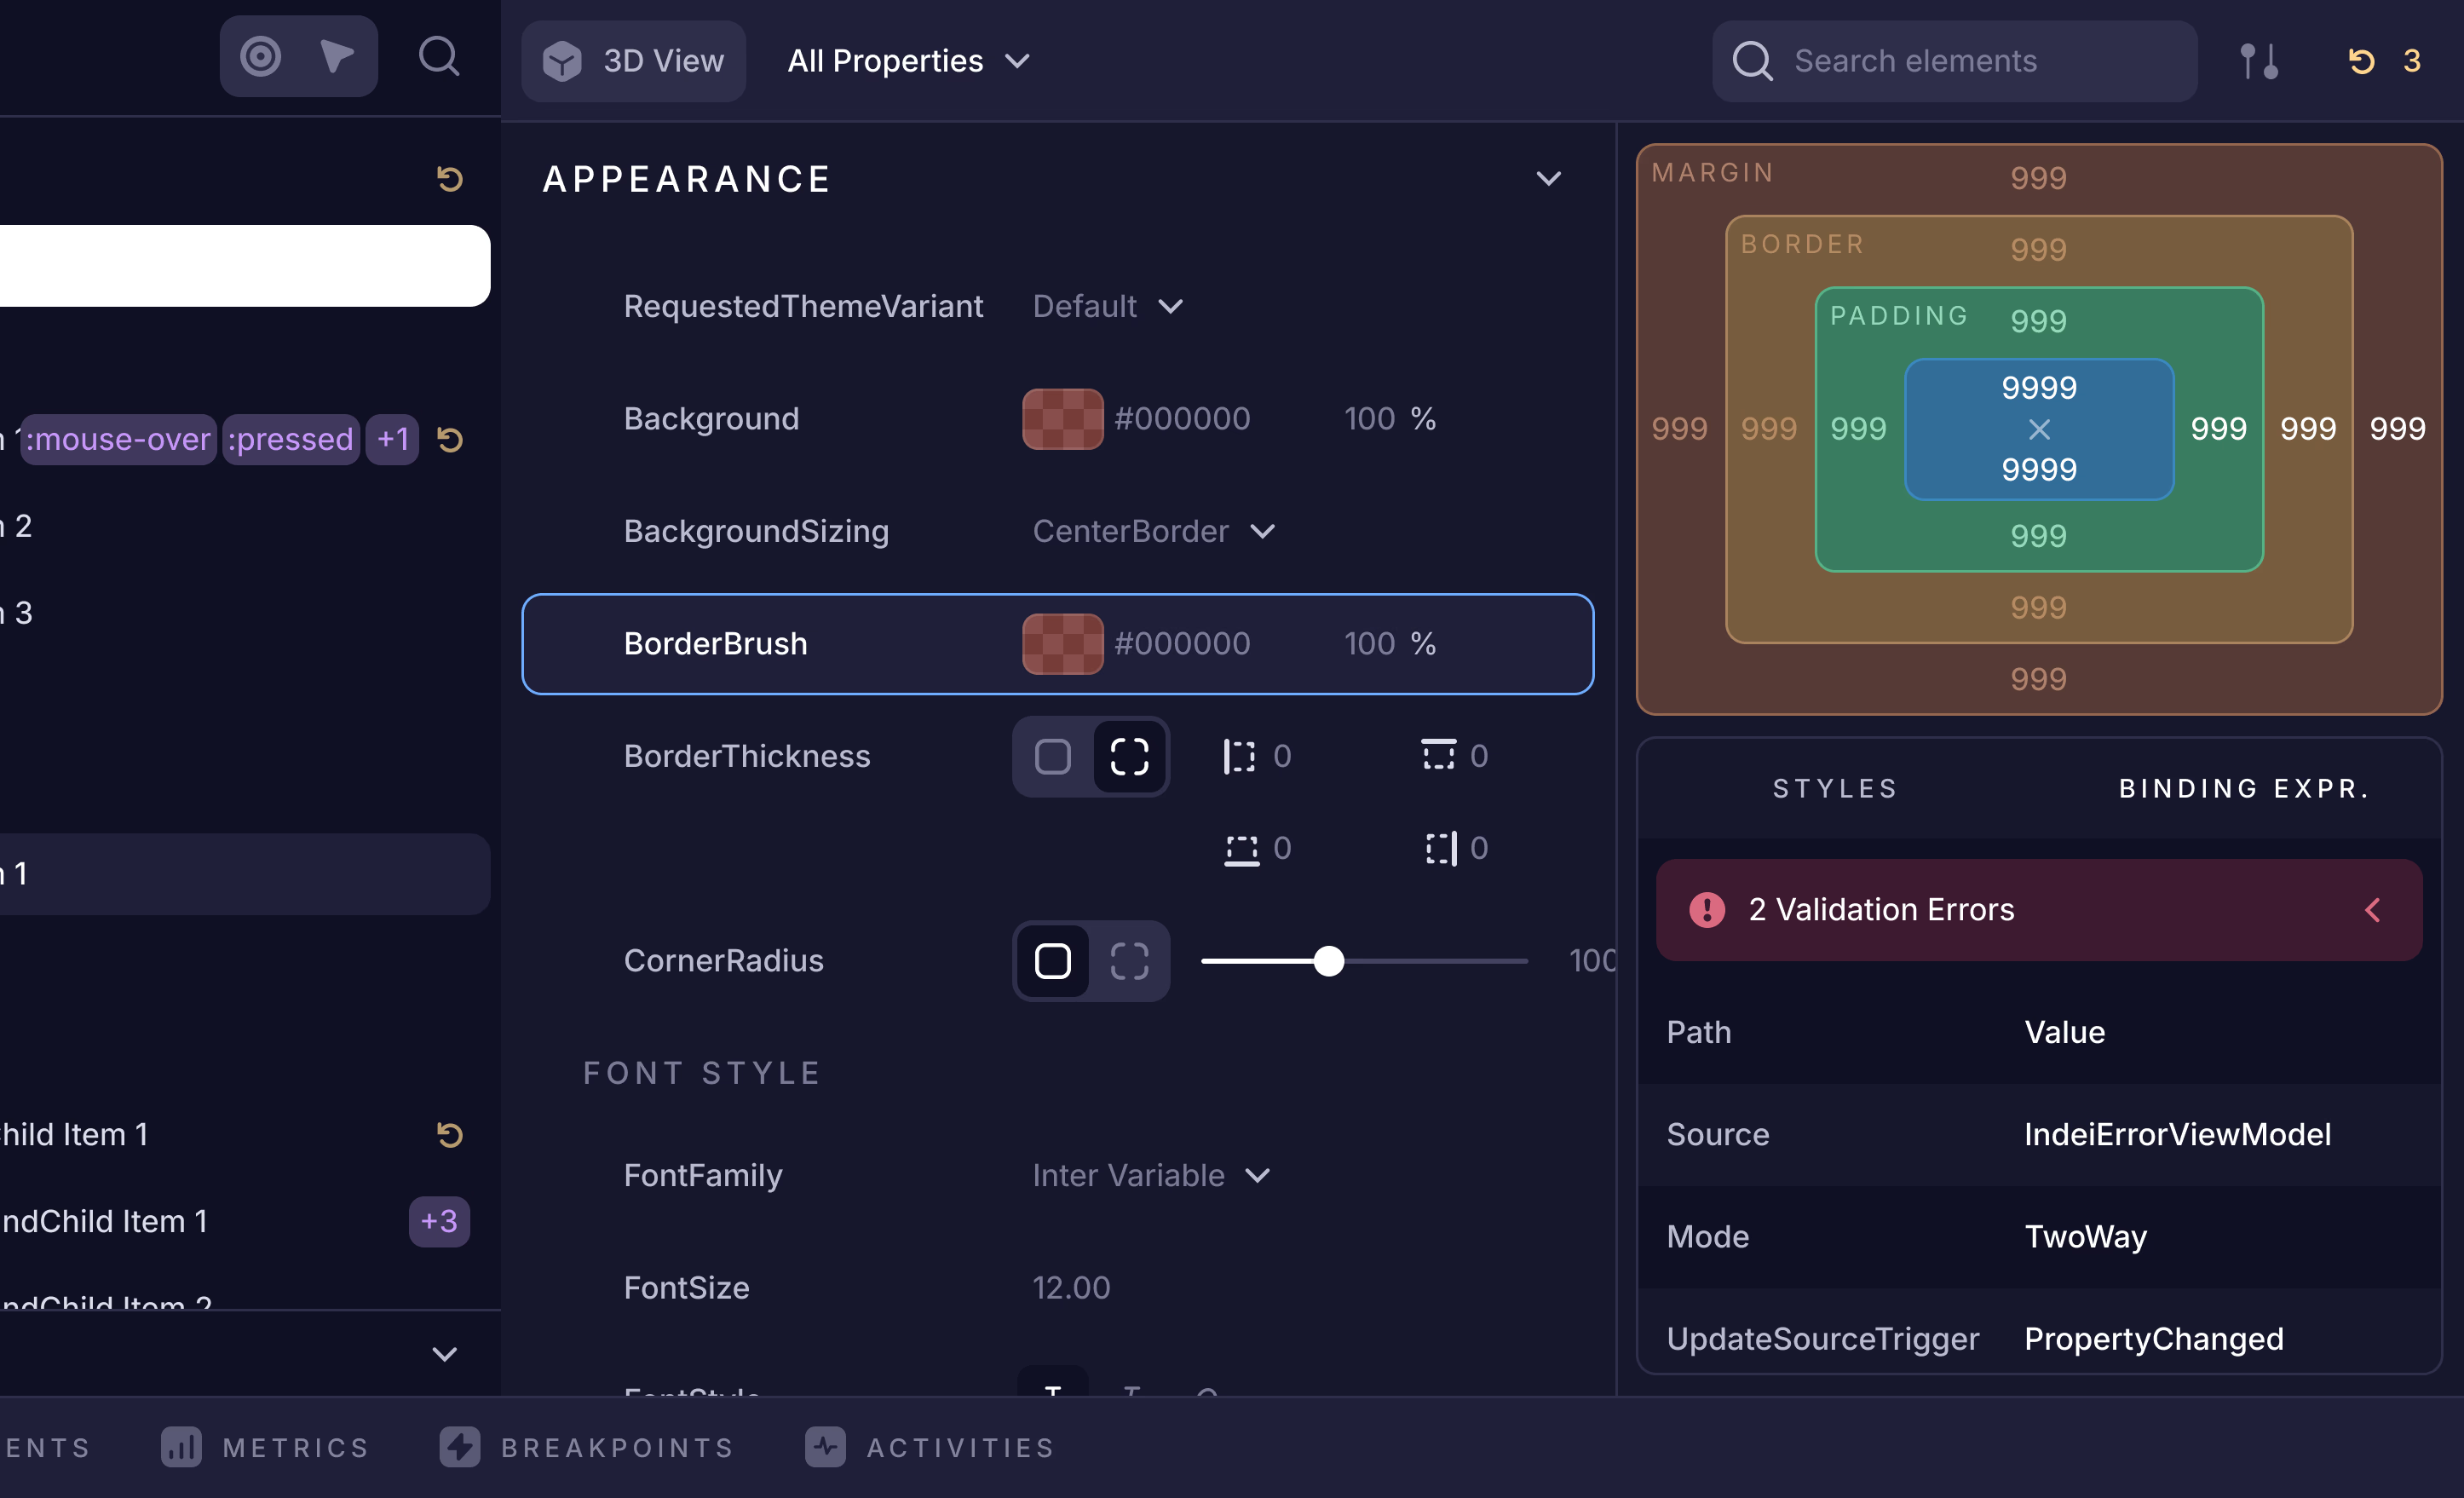
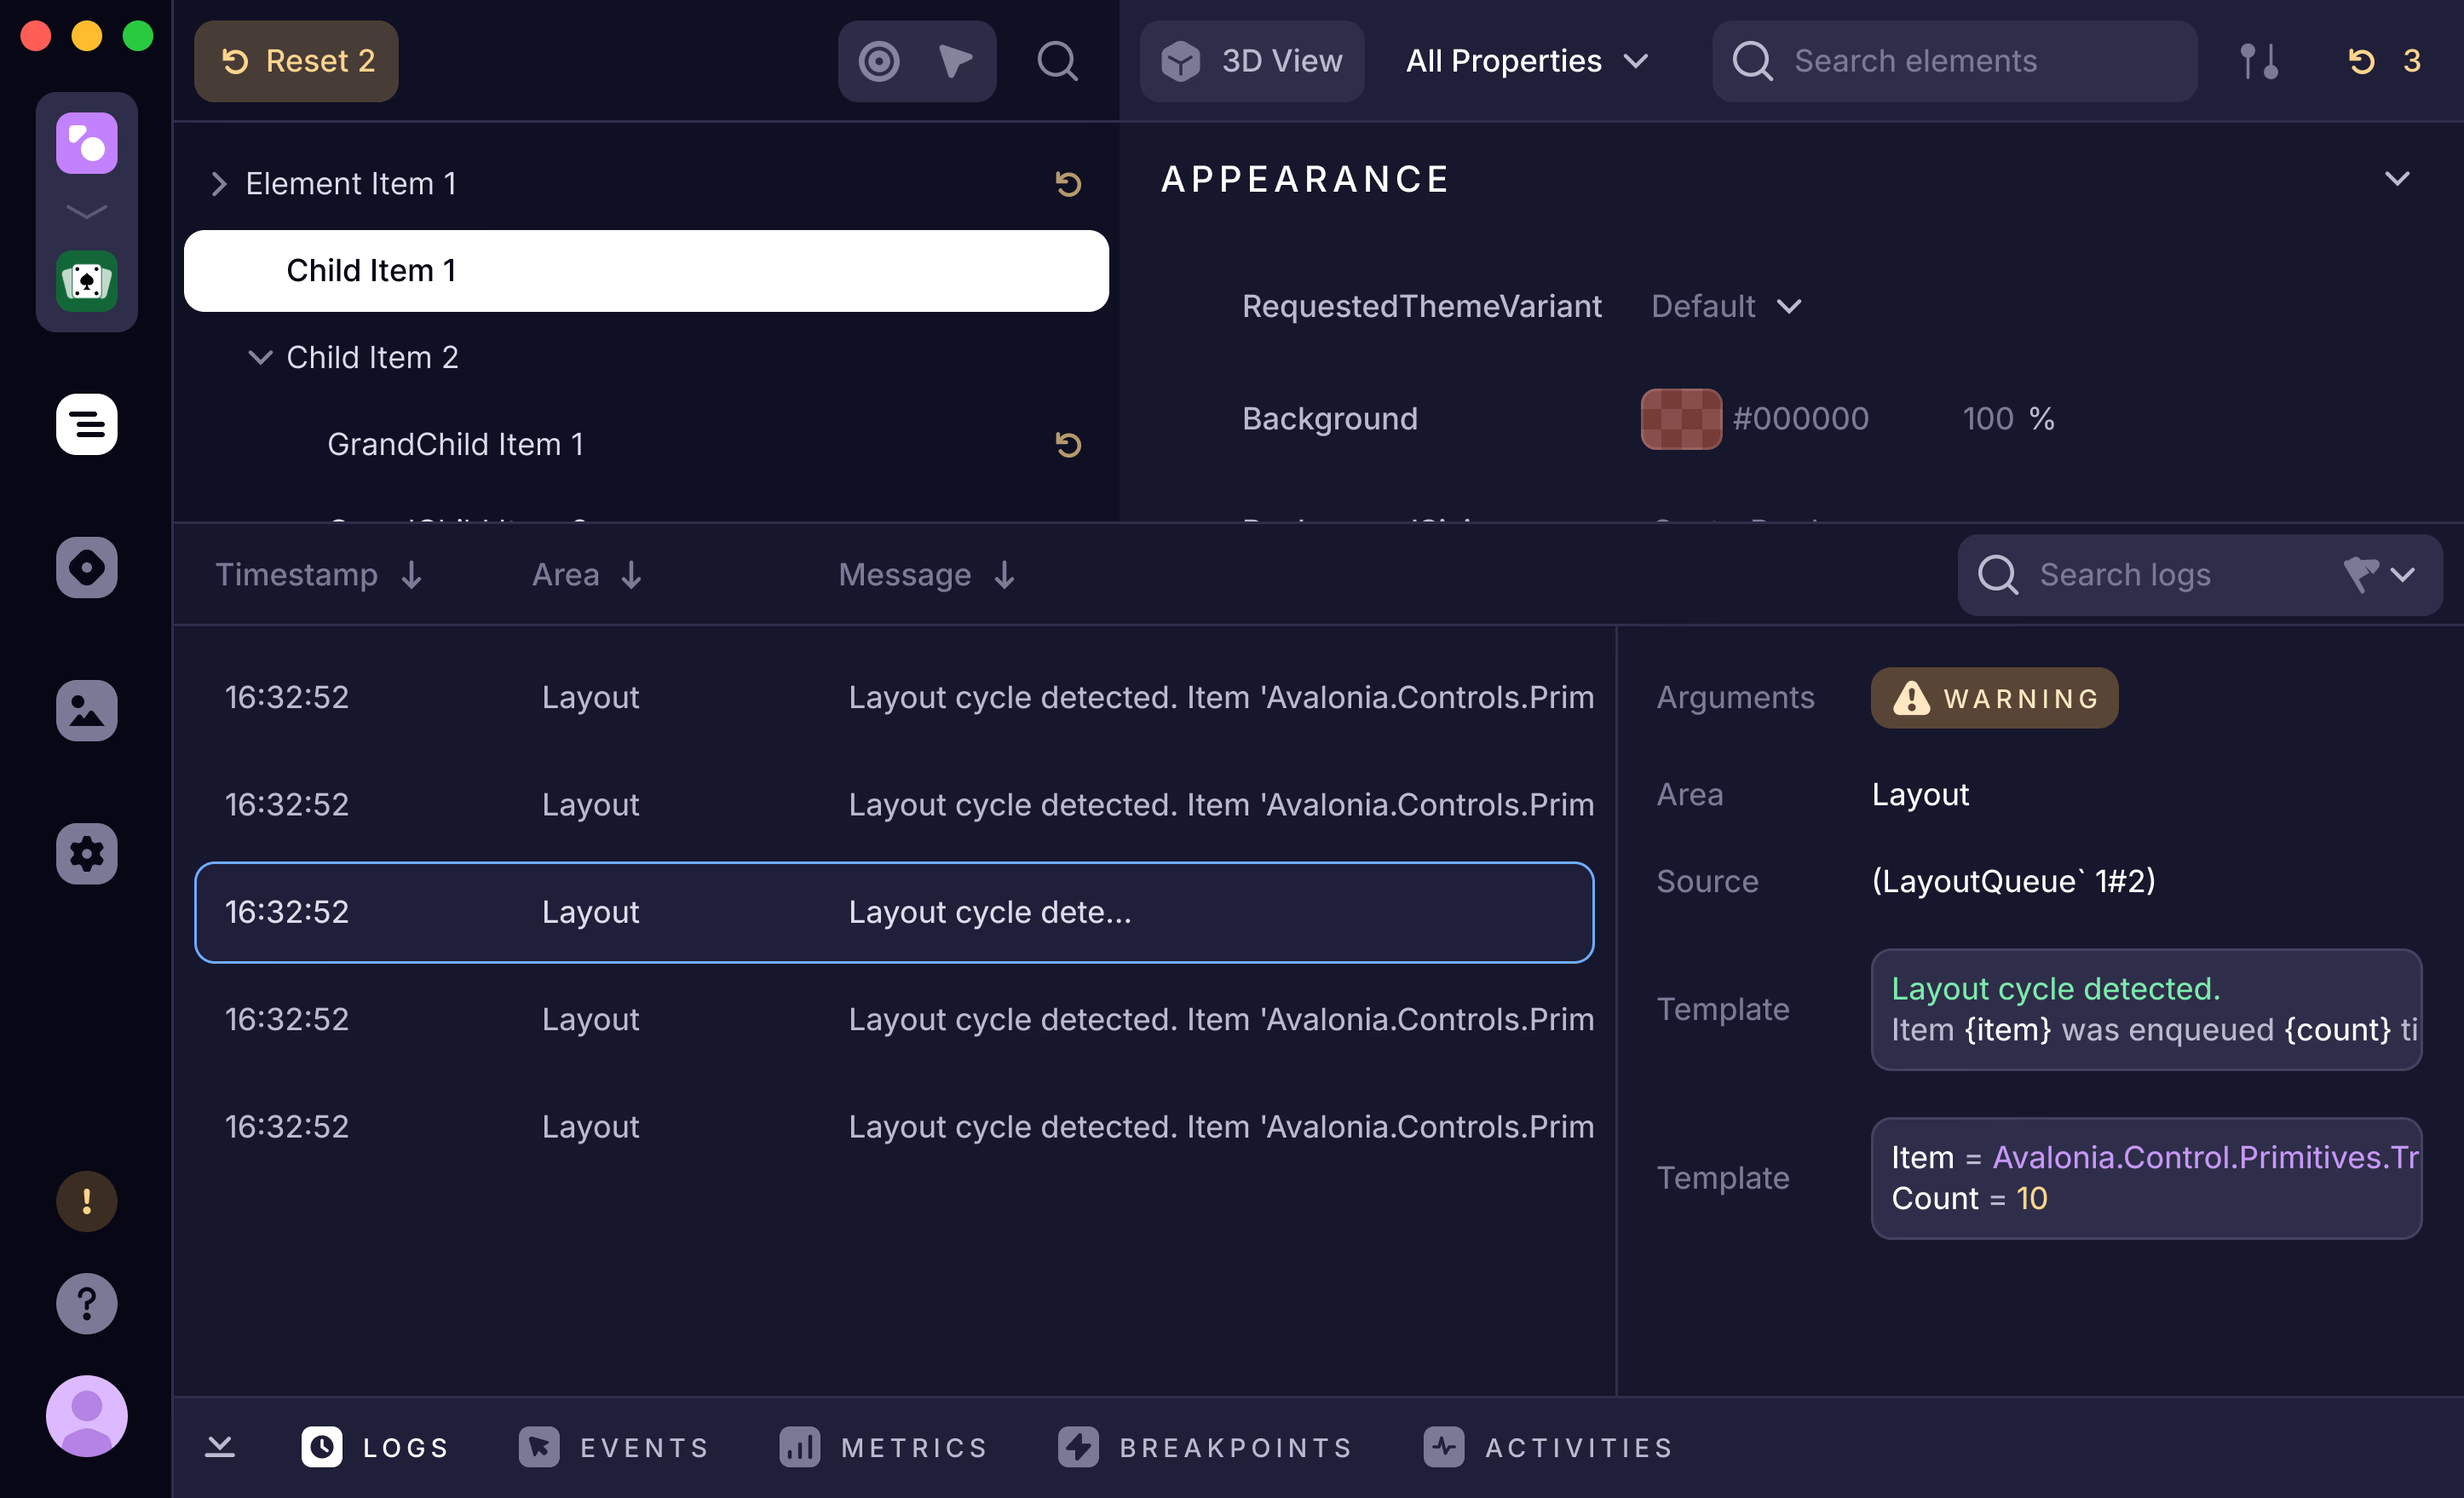
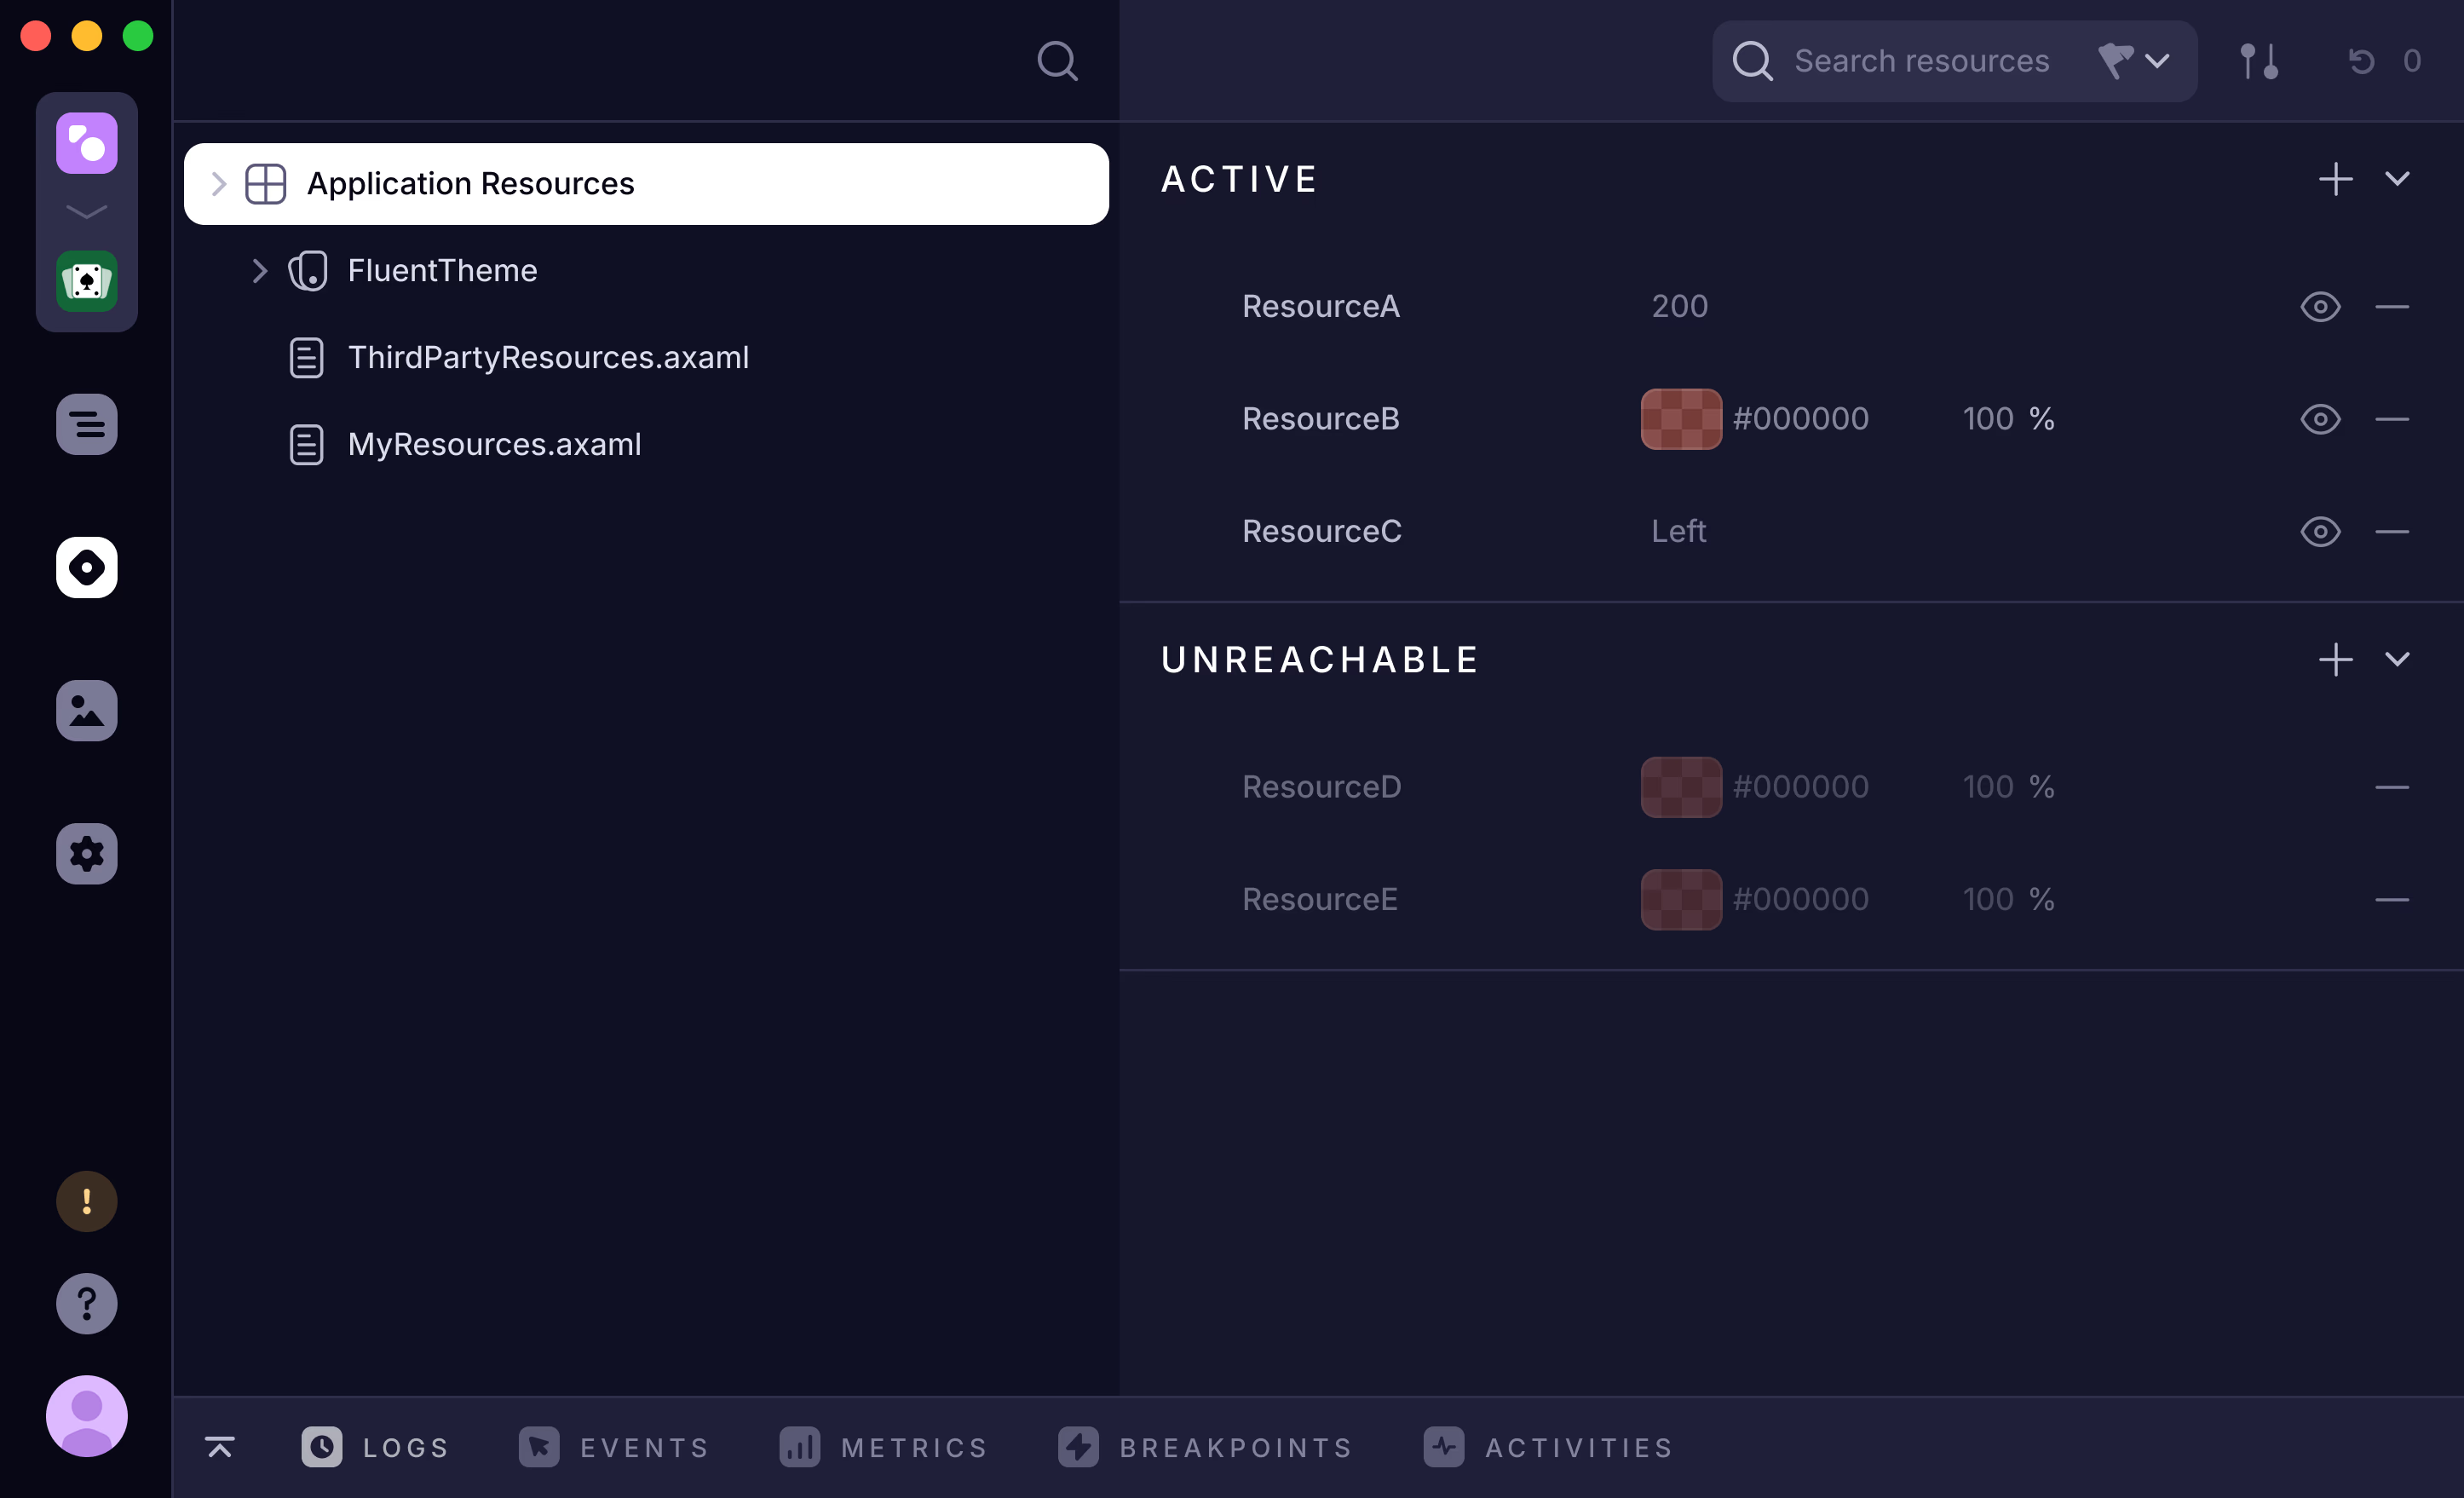
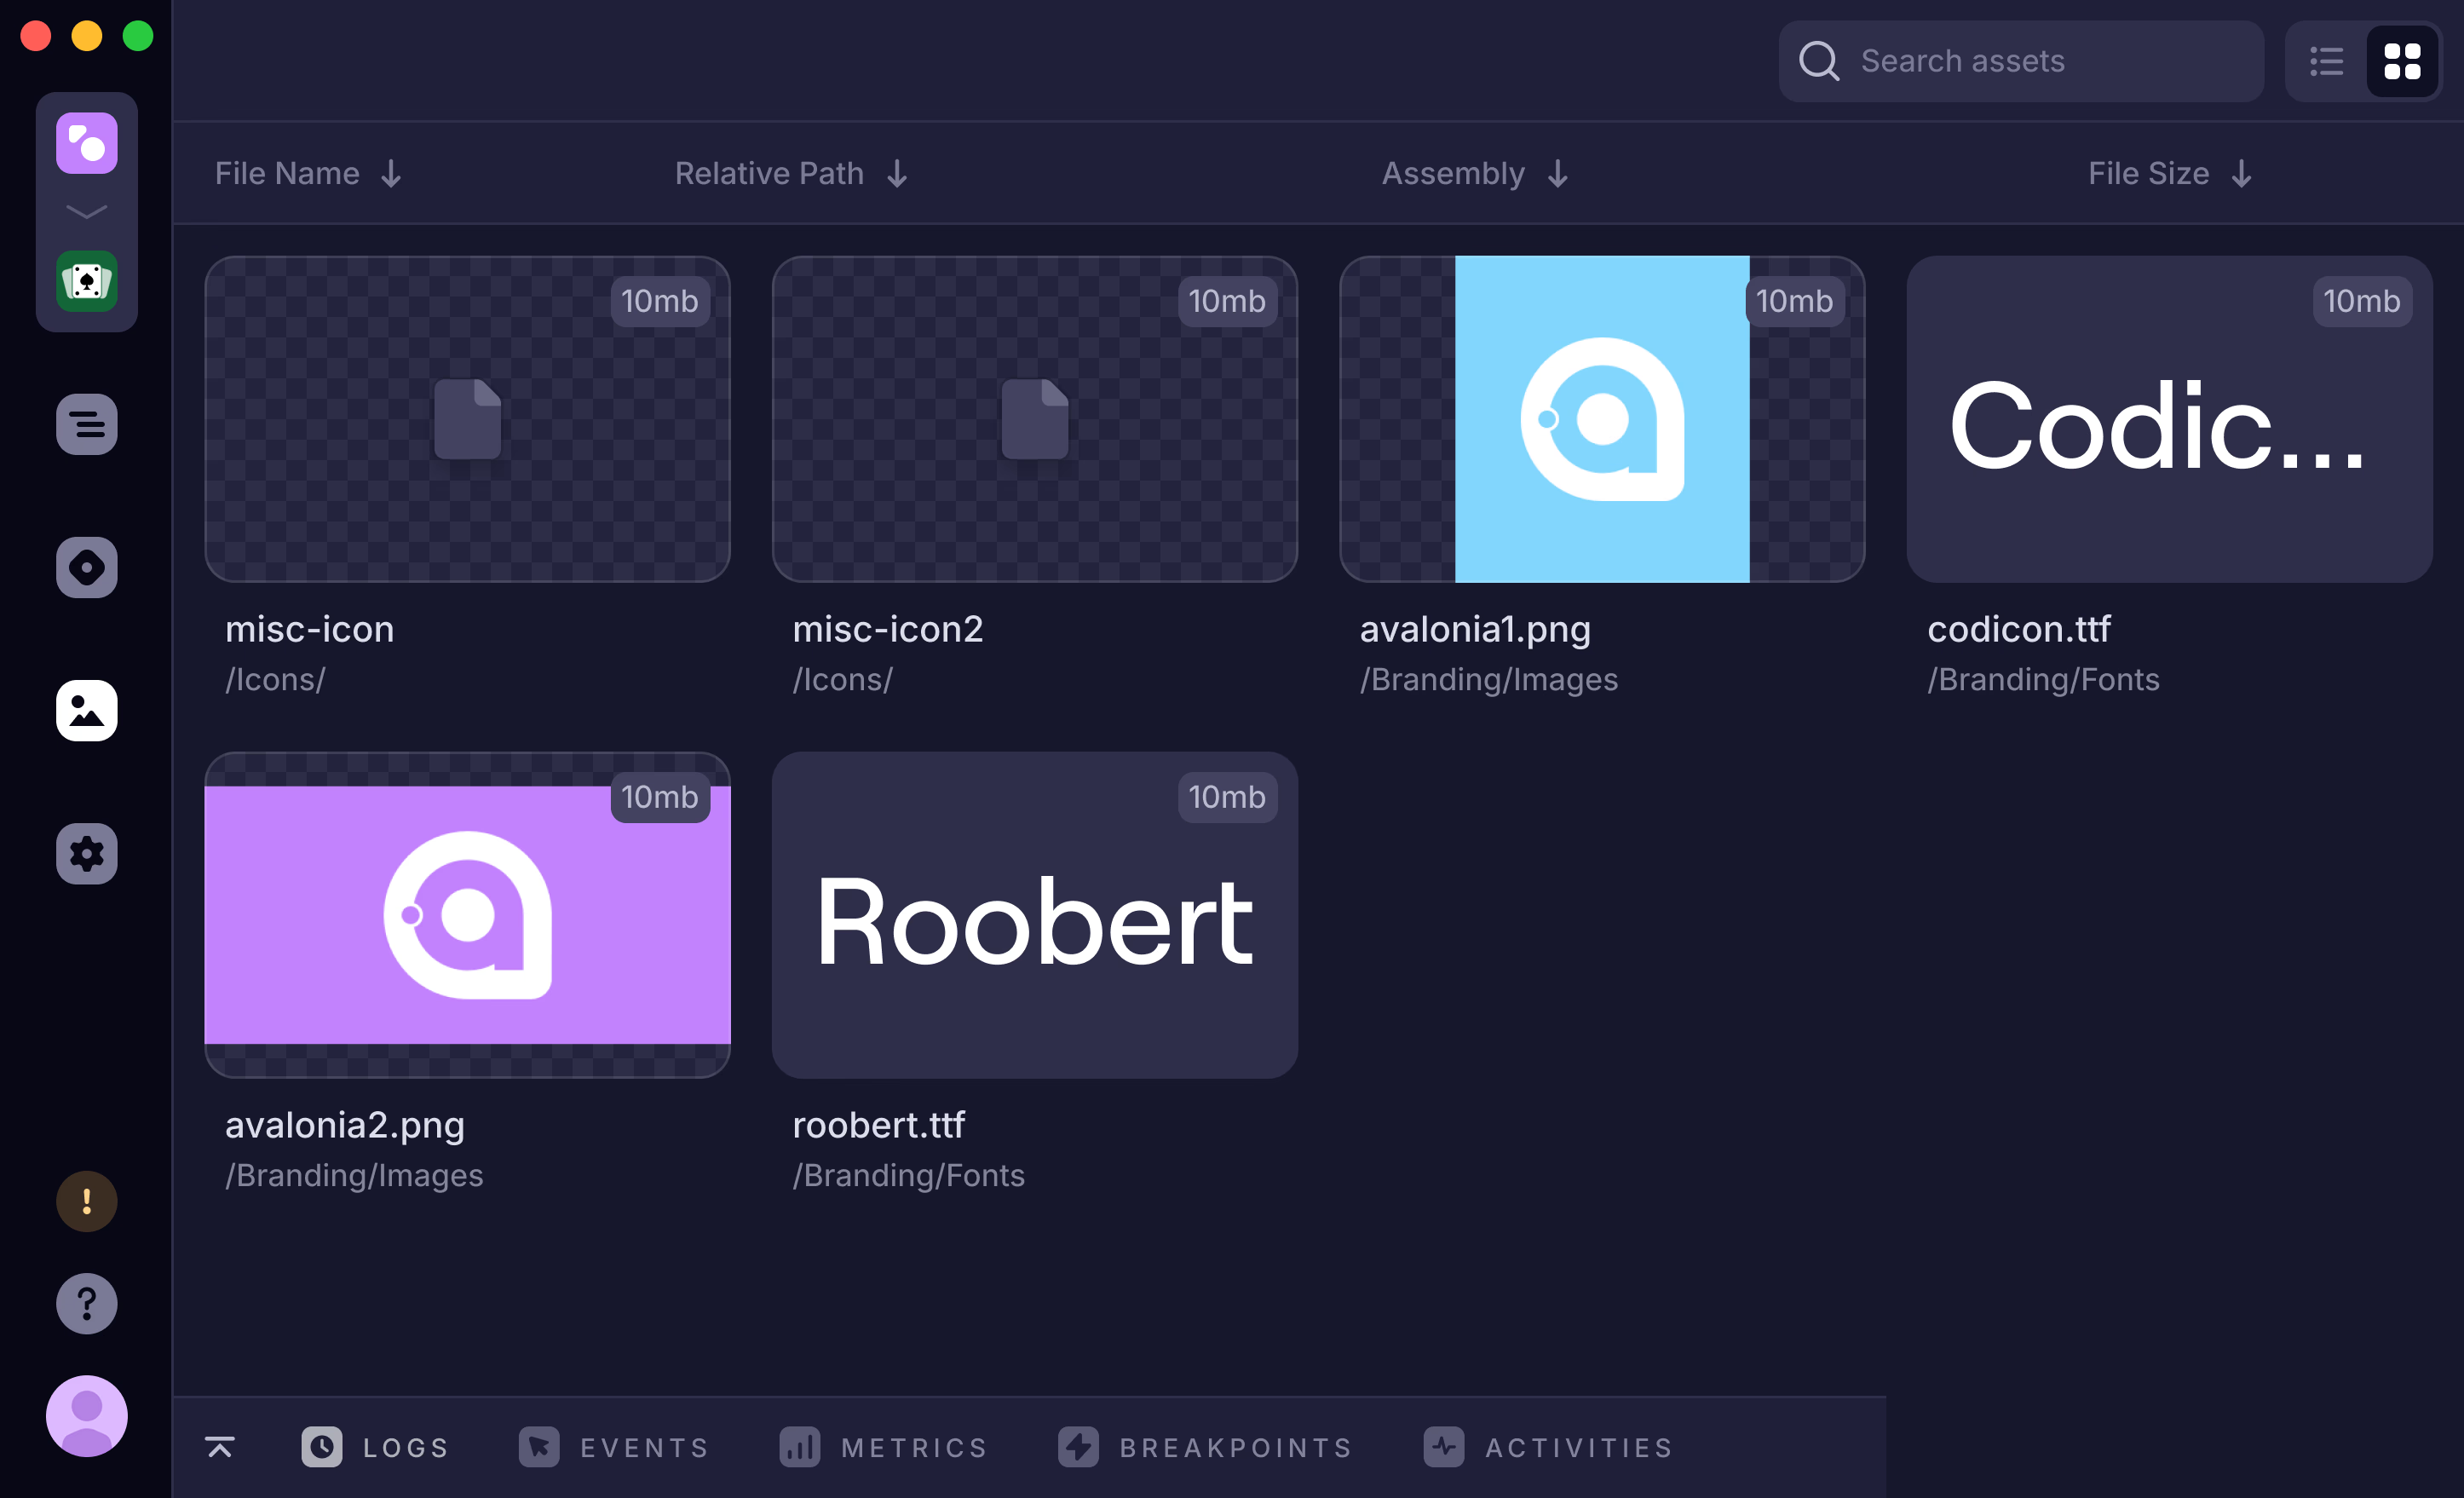
When Avalonia becomes part of your daily workflow, upgrade to a paid subscription and unlock the full diagnostic toolkit. The Plus edition doesn't just show you your UI, it explains it: the logs behind a layout cycle, the binding that never resolved, the resource that fell out of scope, and the asset that bloats your build. It's included with every Avalonia Plus, Pro and Enterprise subscription.
Plus edition
Debug beyond your desktop.
The hardest problems rarely happen on the machine DevTools is running on. Plus pauses your app the moment something changes, profiles what makes it slow, attaches to every platform Avalonia ships to, and opens your running UI to AI agents.
Break on the change, not after it
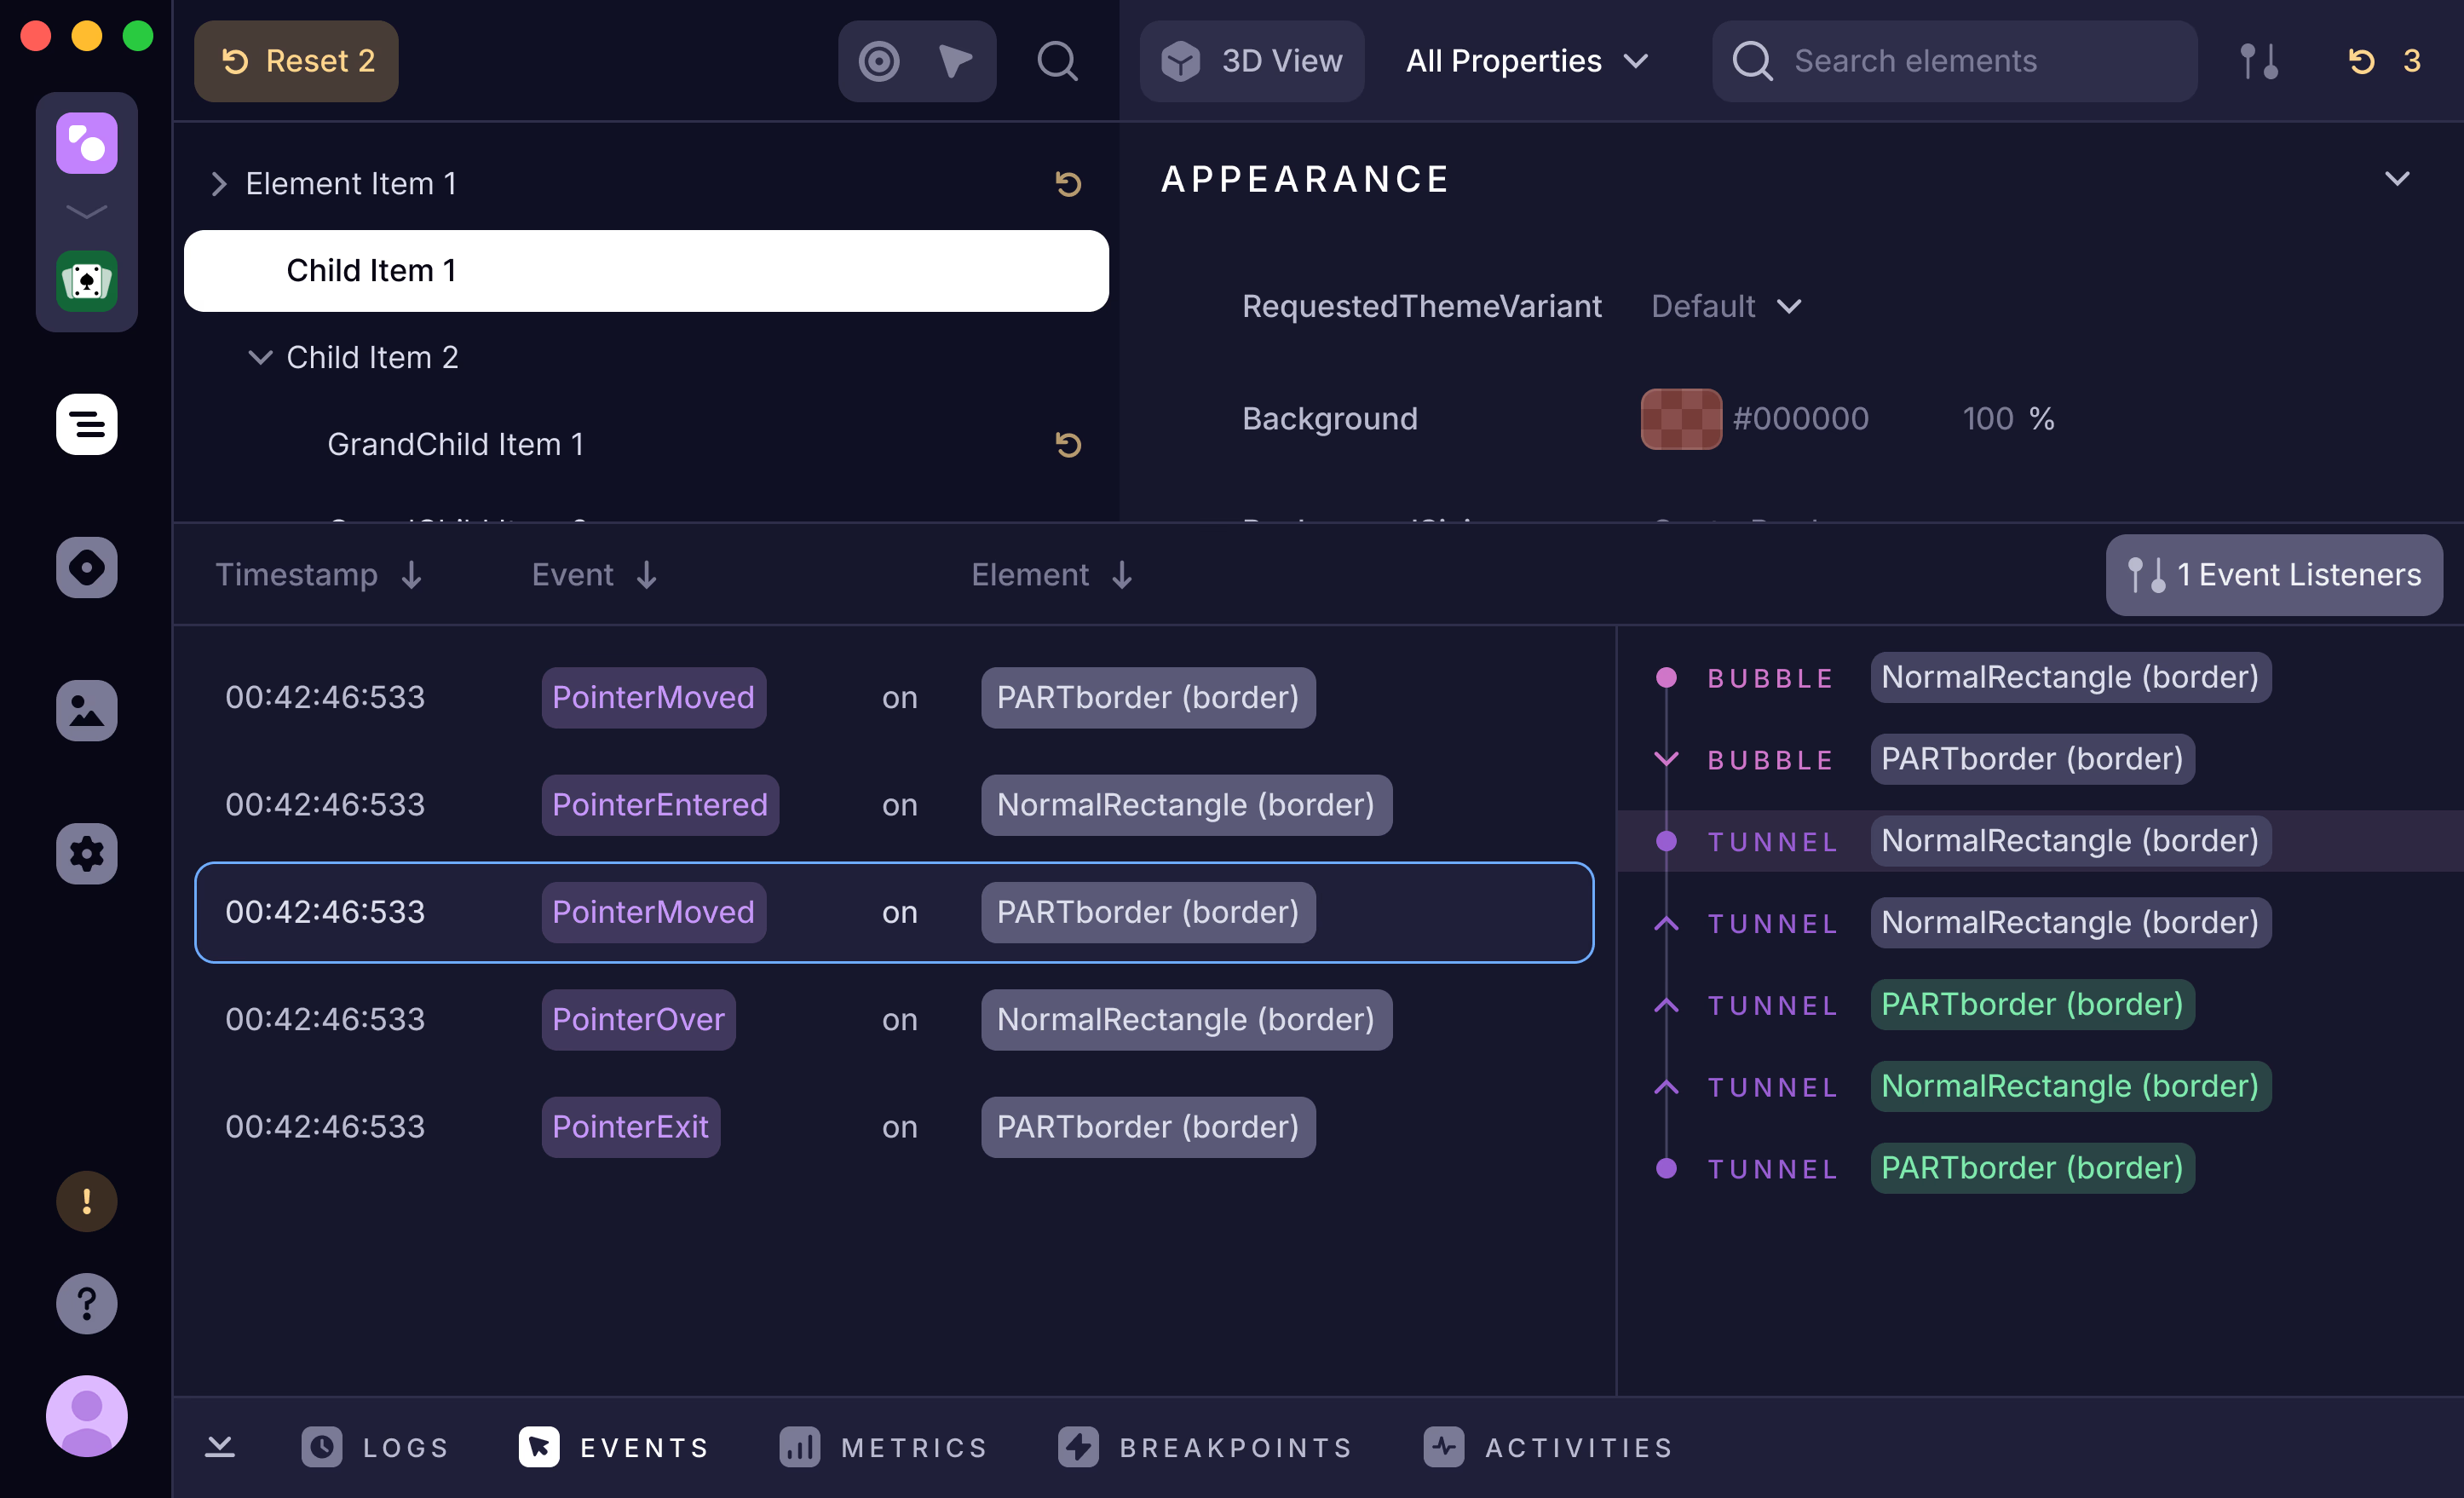
Set breakpoints on element property changes and on routed events, and the app pauses the moment they happen, with the debugger tool ready to show you what fired.
Profile the slow frame
The profiler records what your app spends its time on, so dropped frames and janky scrolling get explained by data instead of guesswork.
Watch the metrics live
Frame timing, memory, and framework counters charted in real time while you reproduce the problem, in the dedicated performance metrics tool.
Attach to mobile, browser and embedded apps
Community stops at desktop. Plus attaches to Android, iOS, browser, and embedded targets, so every platform you ship to gets the same tooling.
Debug over the network
Connect to apps running on other machines, devices on your desk, or VMs. Community is limited to processes on your local machine.
Open your app to AI agents
DevTools doubles as a Model Context Protocol server: AI coding agents like Claude Code can walk the tree, read properties, and capture screenshots of your running app to debug alongside you.
Included with Avalonia Plus, Pro, and Enterprise subscriptions
See pricingIncluded with your subscription
One subscription, the whole toolchain.
Upgrading unlocks more than DevTools. Every Avalonia Plus, Pro and Enterprise subscription also includes Avalonia for Visual Studio, VS Code, Parcel and Hot Reload, so the same subscription upgrades your editor, improves debugging, inspection and shipping, and keeps your app running while you edit it.
The best Avalonia developer experience available today. Live XAML previewer, IntelliSense, project templates, and much more.
The same XAML tooling everywhere VS Code runs: live previewer, IntelliSense, deep analysis, and refactorings on Windows, macOS, and Linux.
Ship what you build: native installers for Windows, macOS and Linux, with code signing and notarization handled in one toolset.
Edit XAML and C# while the app runs: changes apply on save, with no rebuild, no restart, and your app keeps its state.

Customer stories
"Avalonia has a very strong community, and frankly is a joy to work with."
Bill Henning
CEO & Founder, Actipro Software



Why upgrade
Professionals invest in tools that save them time.
The Community edition is an excellent way to start building with Avalonia. The Plus edition is designed for developers who ship Avalonia apps every day, where every unexplained layout, every silent binding failure and every unreachable device slows the fix. Plus removes that friction, so you can stay focused on building your application.
Your app runs everywhere. Your debugging stops at the desktop.
The bug reports come from phones and browsers. Plus attaches to mobile, browser, and embedded targets, on your machine or over the network.
A binding fails silently and the screen just sits there
Nothing renders and nothing errors. Binding diagnostics put the path, source, and validation failures on the element itself.
You can see the event fire. You cannot catch it happening.
Watching the feed is not the same as stopping on it. Breakpoints pause the app the instant a property changes or an event fires.
The UI stutters and you are guessing why
The profiler and live metrics replace hunches with numbers, so you fix the frame that drops instead of the one you suspected.
Editions
DevTools comes in two editions
Community covers everyday inspection of desktop apps at no cost, while Plus unlocks every diagnostic tool, breakpoints, profiling, mobile and remote debugging, and AI integration.
Core features
Plus edition
FAQ
Your questions,
answered.
Can't find what you need? We're here to help.
The Community edition is free for non-commercial use: learning, evaluation, and personal projects. It covers everyday inspection of desktop apps. The Plus edition unlocks the full diagnostic toolkit and is included with Avalonia Plus, Pro, and Enterprise subscriptions.
Community attaches to Avalonia desktop apps running on Windows, macOS, and Linux on your local machine. Plus also attaches to mobile, browser, and embedded targets, and connects to apps running on other machines over the network.
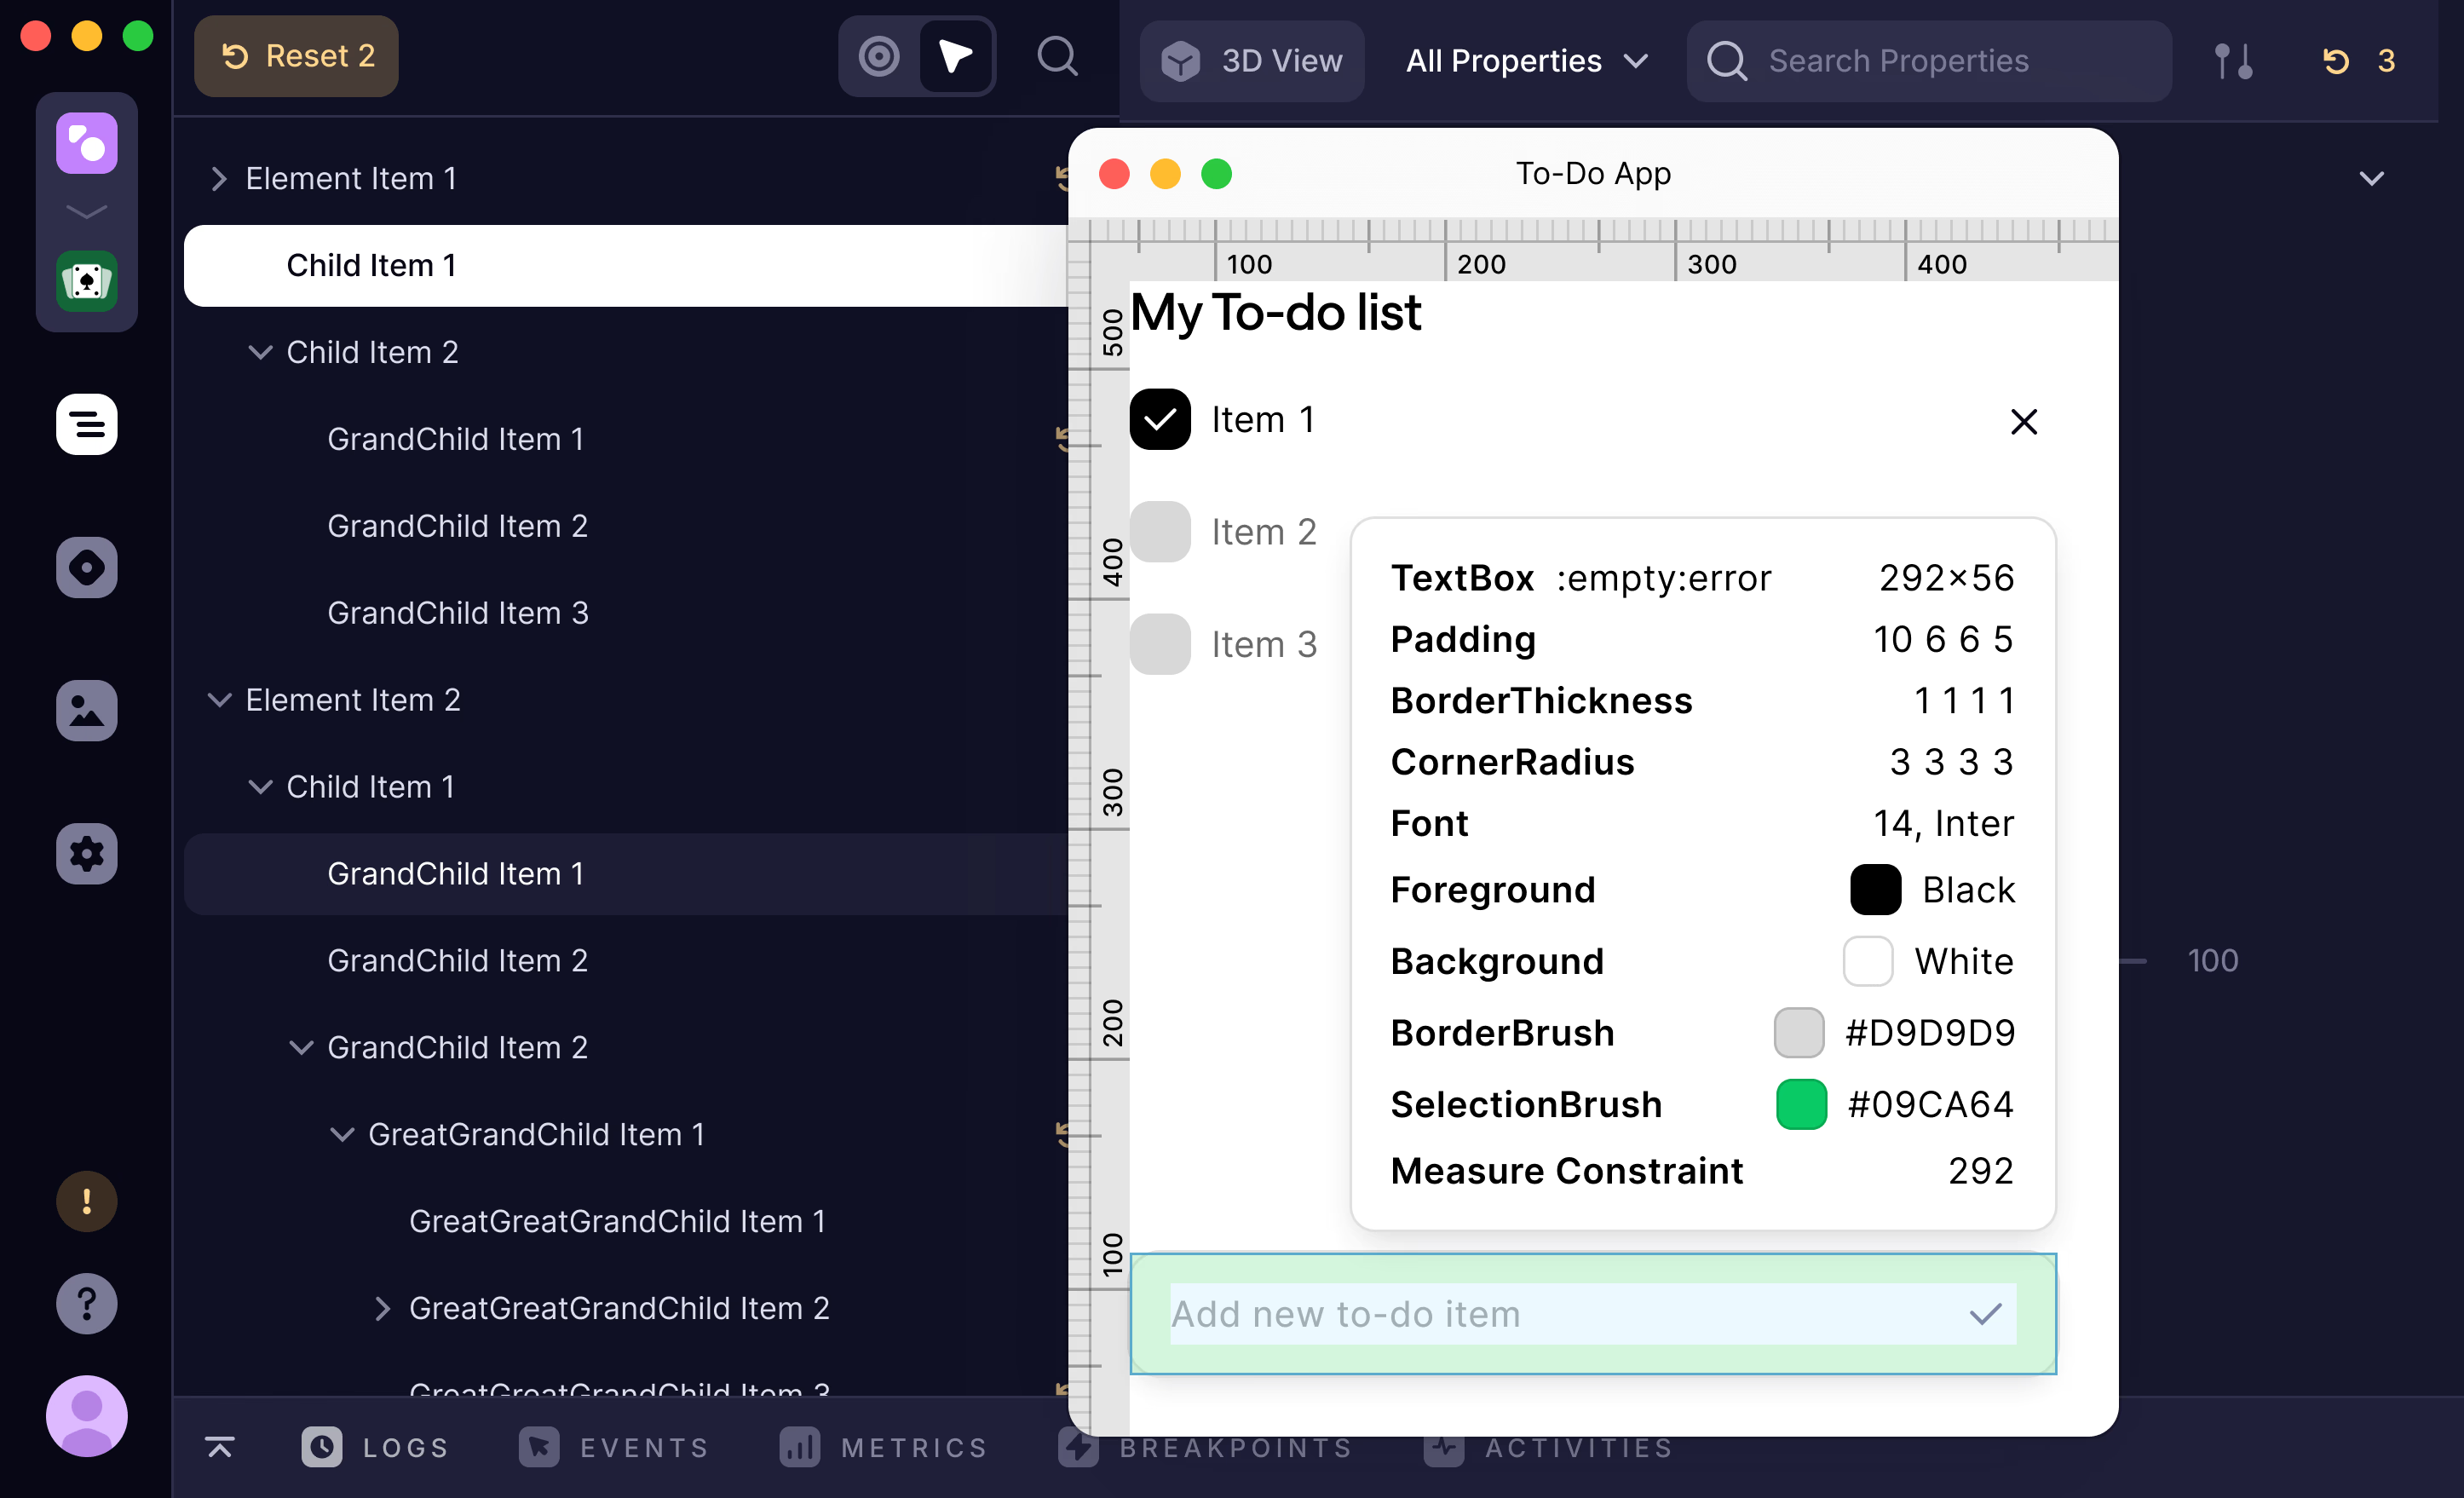
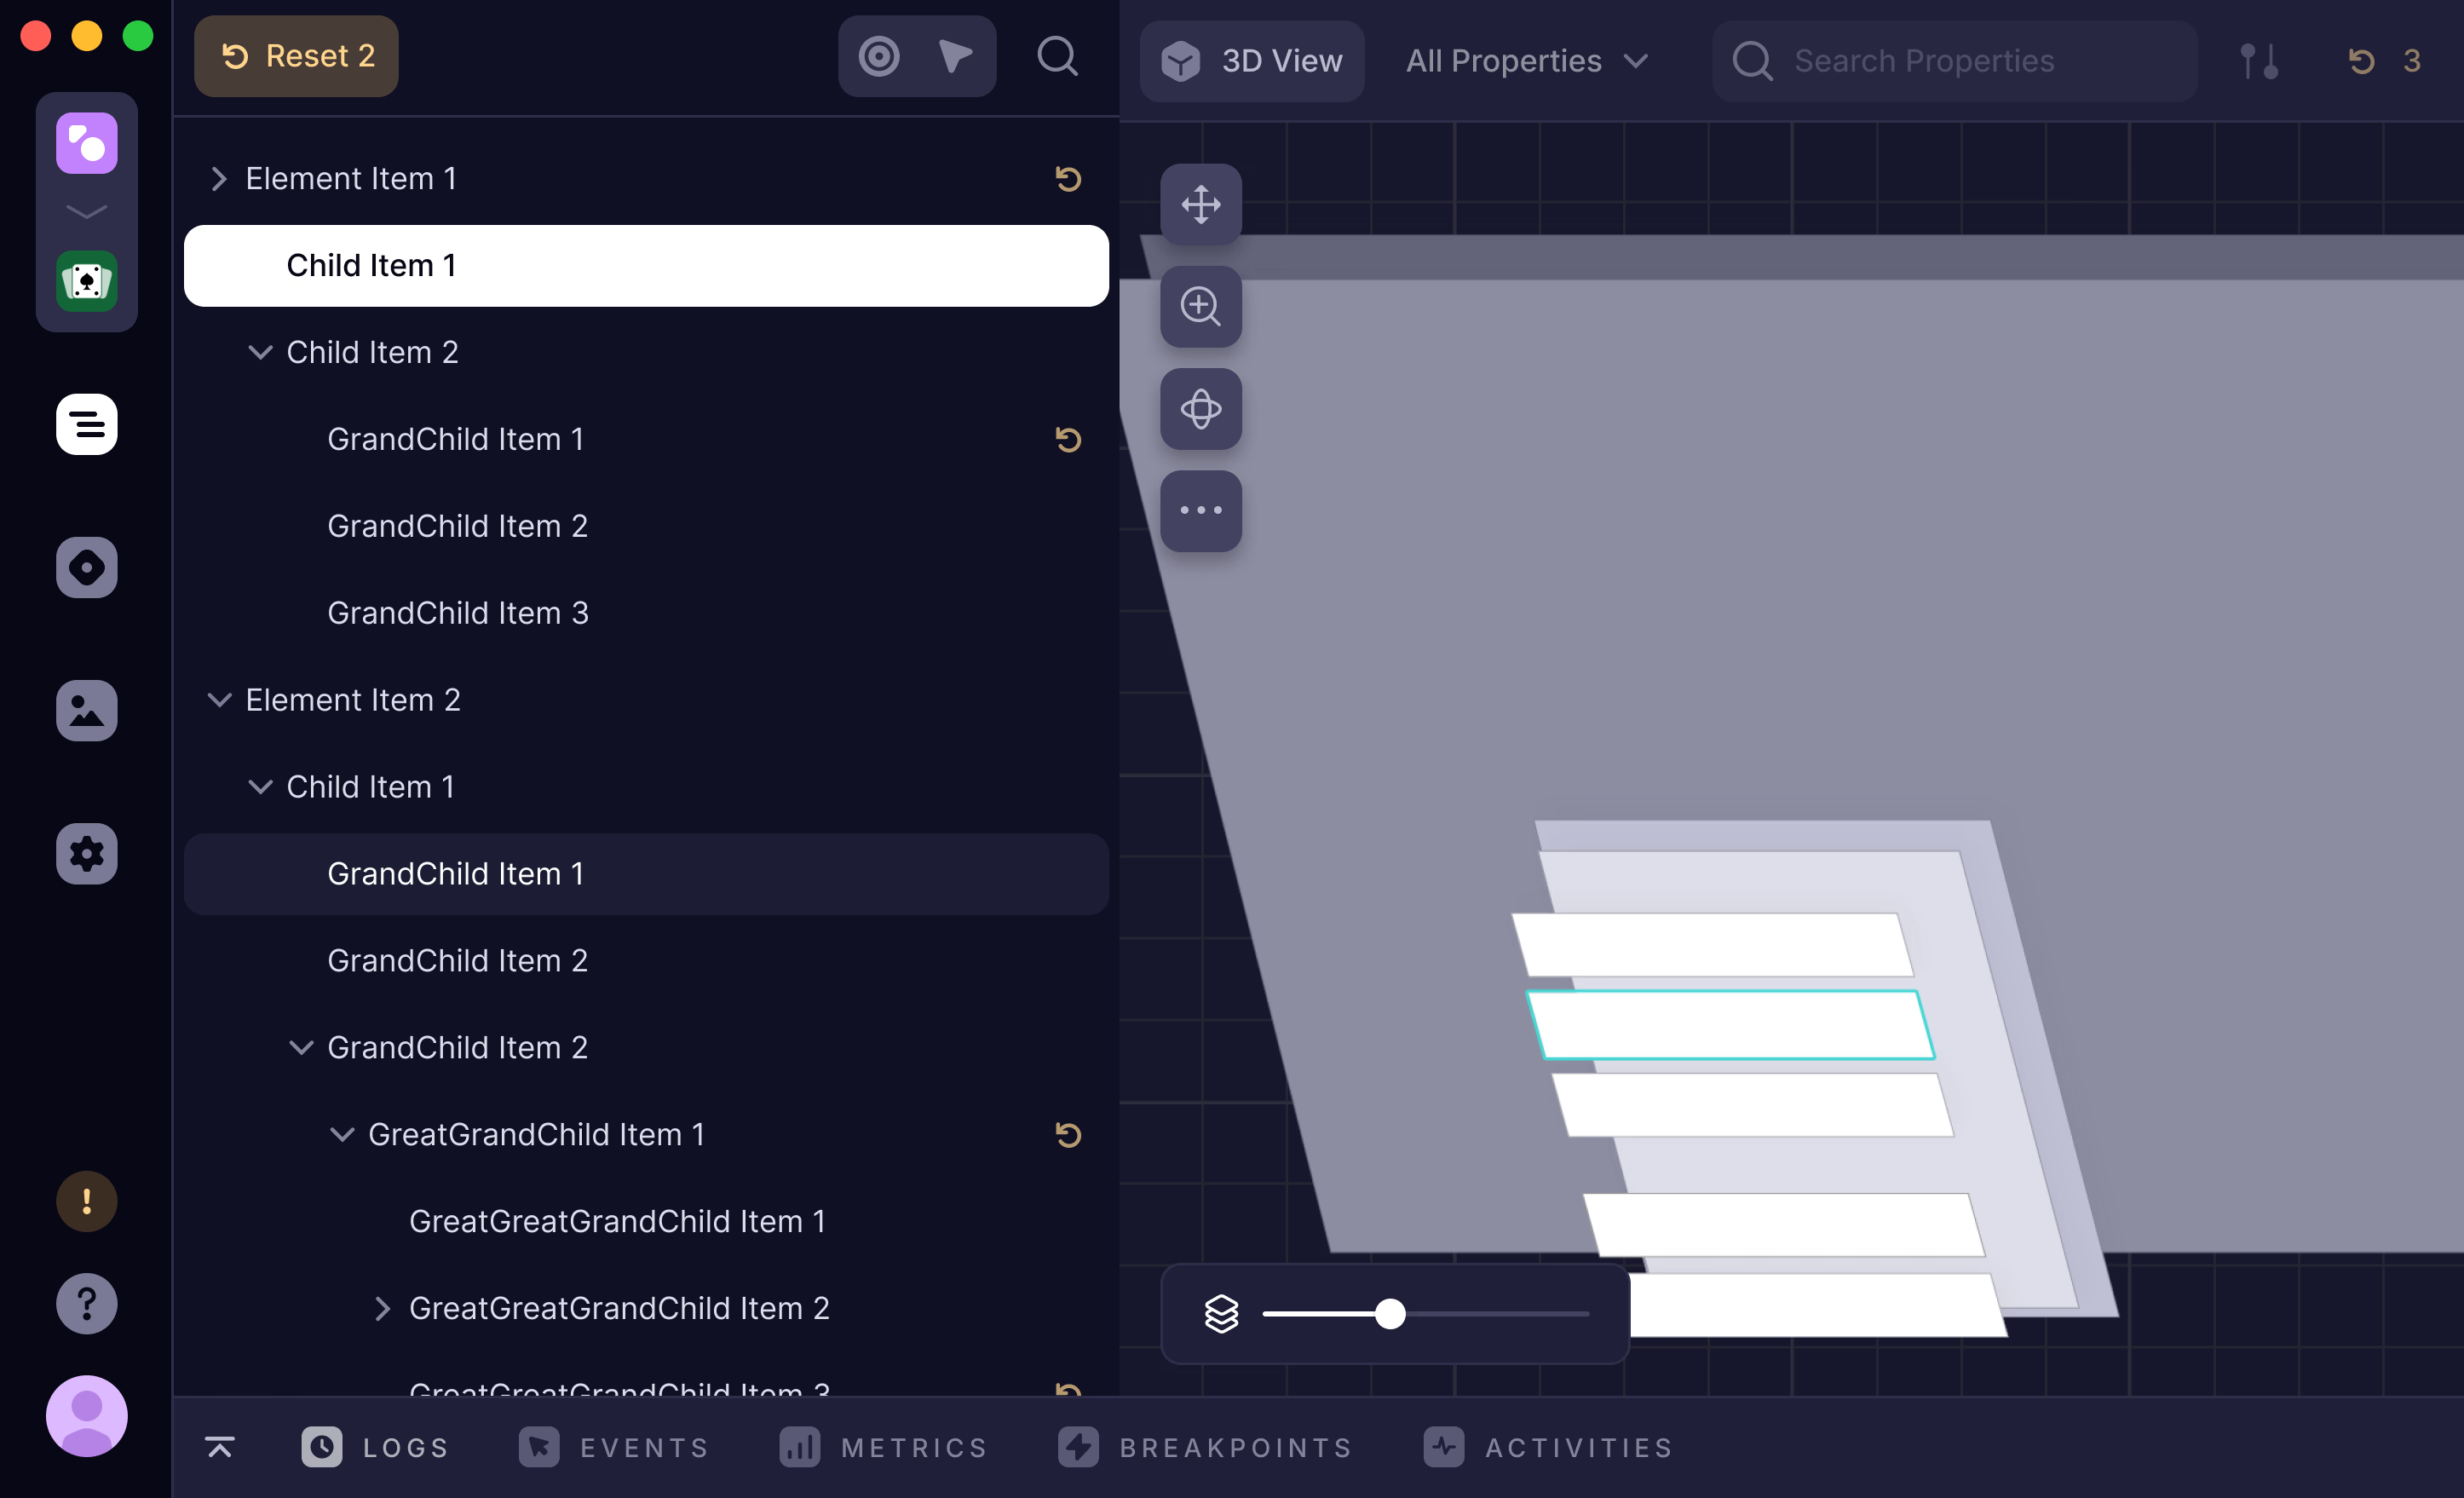
Plus unlocks every tool in the shell: logs, the resources browser, the asset manager, the debugger with breakpoints on property changes and routed events, performance profiling, live metrics, 3D composition snapshots, binding diagnostics, and measurement overlays. It also removes the connectivity limits and enables the Model Context Protocol integration. The edition comparison on this page has the full breakdown.
DevTools can act as a Model Context Protocol server, so AI coding agents such as Claude Code can inspect your running app: reading the element tree, checking properties, and capturing screenshots to debug alongside you. The MCP integration is exclusive to the Plus edition.
No. Every tool stays visible in the shell, so you can always see what DevTools can do. Tools that need a Plus licence simply explain that instead of loading data.
See what your app is really doing
Try the Plus edition free for 30 days and debug with the full toolkit: breakpoints, profiling, binding diagnostics, and every platform you ship to.