Bring data to life, in real-time.
A powerful, MVVM-ready charting library, extensive chart types, and performance you can trust.
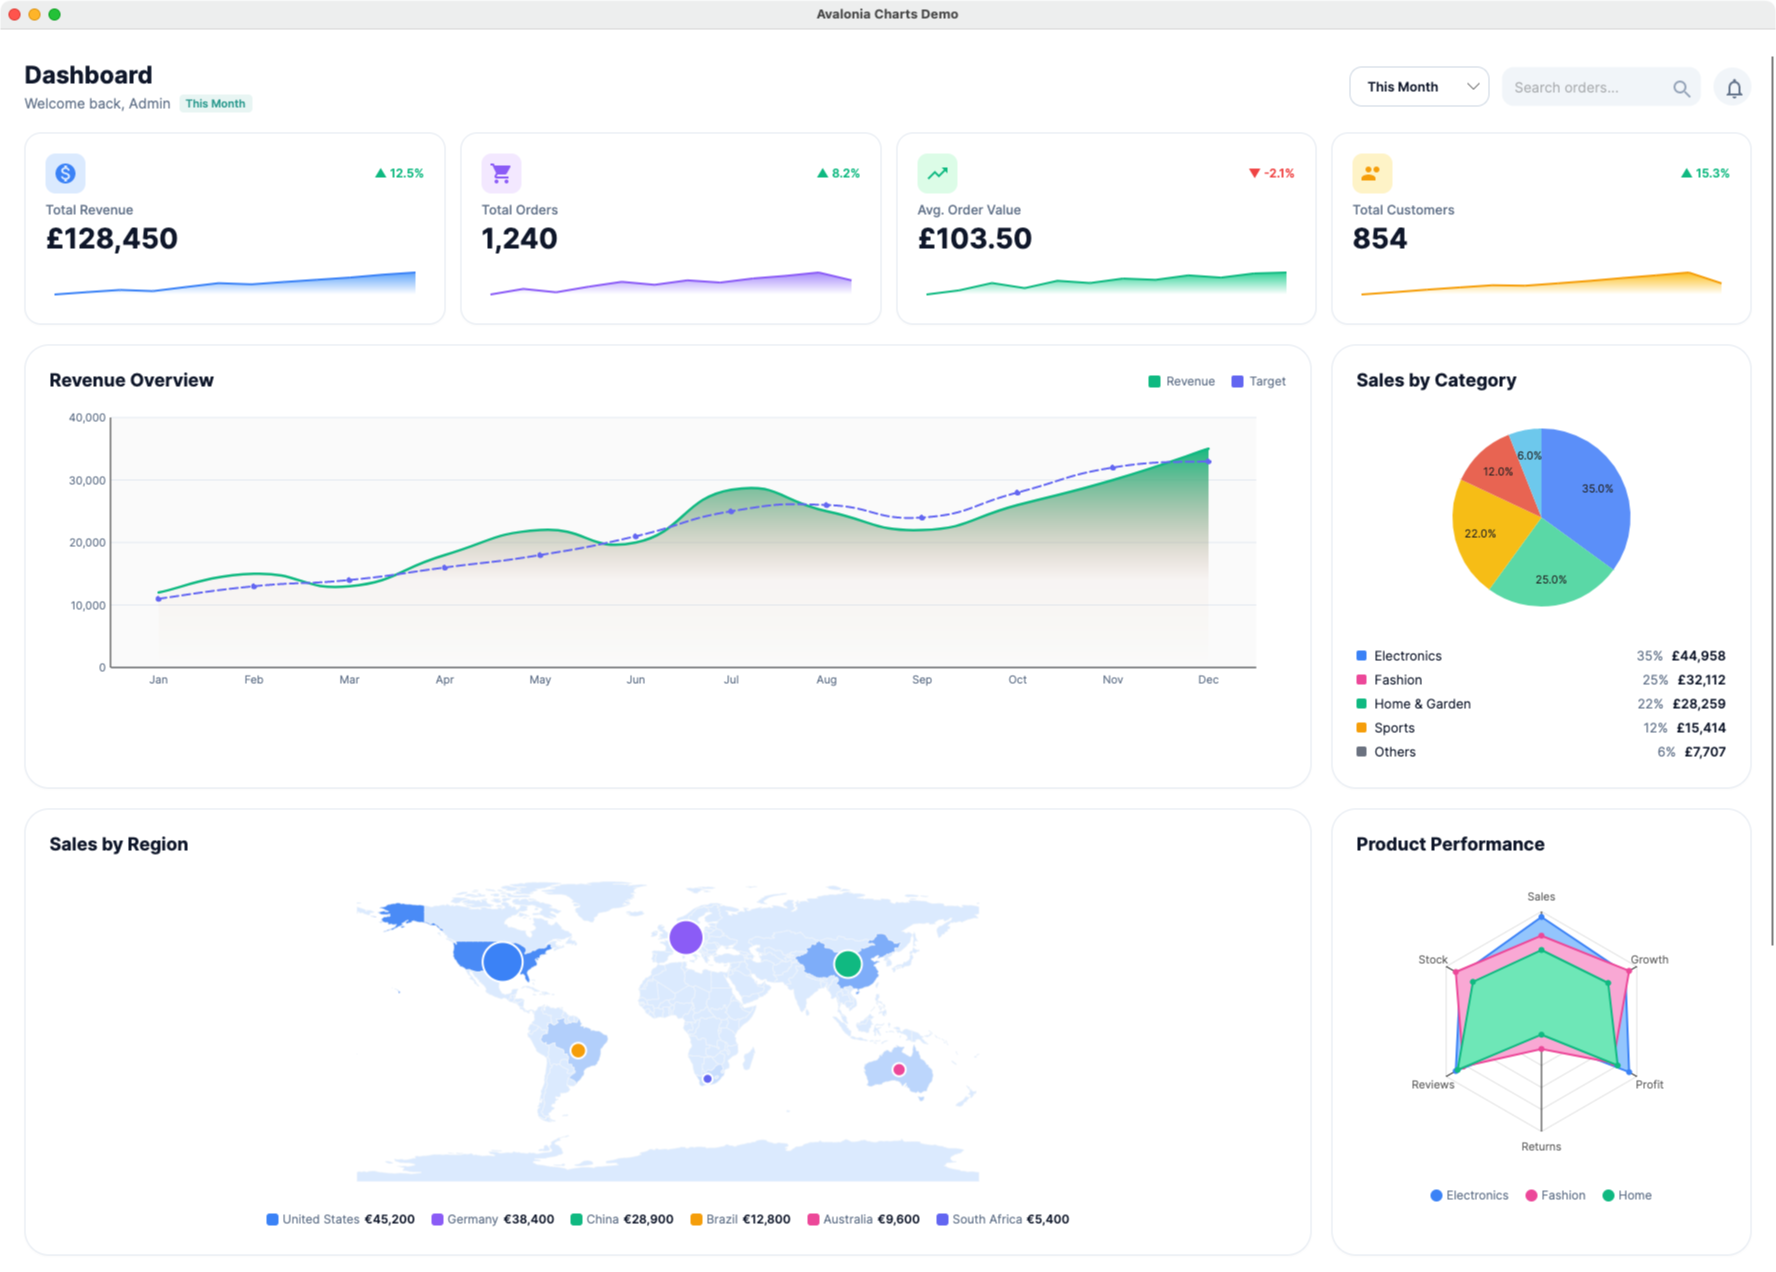
Trusted by .NET teams around the world
Features
Seventy chart types on one MVVM-ready API.
Bind a collection, pick a series, and the same chart renders natively on desktop, mobile and the browser, with zoom, crosshairs and tooltips already wired up.

70+ chart types
An incredibly rich set of chart types to display your data every possible way.

Cross-platform
Built for use on desktop all the way down to mobile devices with tap and gesture functionality.

Optimized performance
Efficient rendering and smart redraw strategies to ensure smooth interactions.

MVVM-ready
Integrate charts naturally into your application without code-behind workarounds.

Accessibility focused
Built-in features like displaying data in patterns to make sure your charts are accessibility compliant.

Custom theming
Light and dark modes built-in with full override capabilities for styling.
Functionality
Rich interaction features.
Zoom, crosshairs, trackballs, tooltips and selection are built in and data-bound. None of them is a plugin, and none needs code-behind to wire up.

Zoom & pan
Users can scroll to zoom, drag to pan, and pinch on touch devices. ZoomMode controls whether zoom applies horizontally, vertically, or both. A ChartRangeSelector overlay provides a visual sub-range picker, ideal for financial and telemetry dashboards.
Additional features

Axis
Types, titles, gridlines, and dual-axis configurations.

Markers & labels
Visual indicators and data labels for precise value reading.

Legend
Interactive legends for series visibility control.

Exporting
Save and share your charts as high-quality JPG or PNG images.

Animation
Smooth entry transitions with configurable duration and easing.

Annotations
Add lines, bands and custom shapes to focus on specific data.

Trendlines
Visualize data trends with linear, exponential and moving average models.

Real-time data
Efficient incremental updates for streaming feeds and live dashboards.
Charts library
Supported chart types.
 Line
Line Spline
 Step line
 Area
Area Spline area
 Stream graph
 Area range
 Bar
Bar Stacked bar
 Stacked 100%
 Stacked area
 Range bar
 Waterfall
 Histogram
 Pictorial bar
 Lollipop
 Variance
 Scatter
 Bubble
 Scatter line
 Box plot
 Error bar
 Dot plot
 Hilo
Hilo Candlestick
 OHLC
OHLC Point & figure
Charts library
Check out the full charts library.
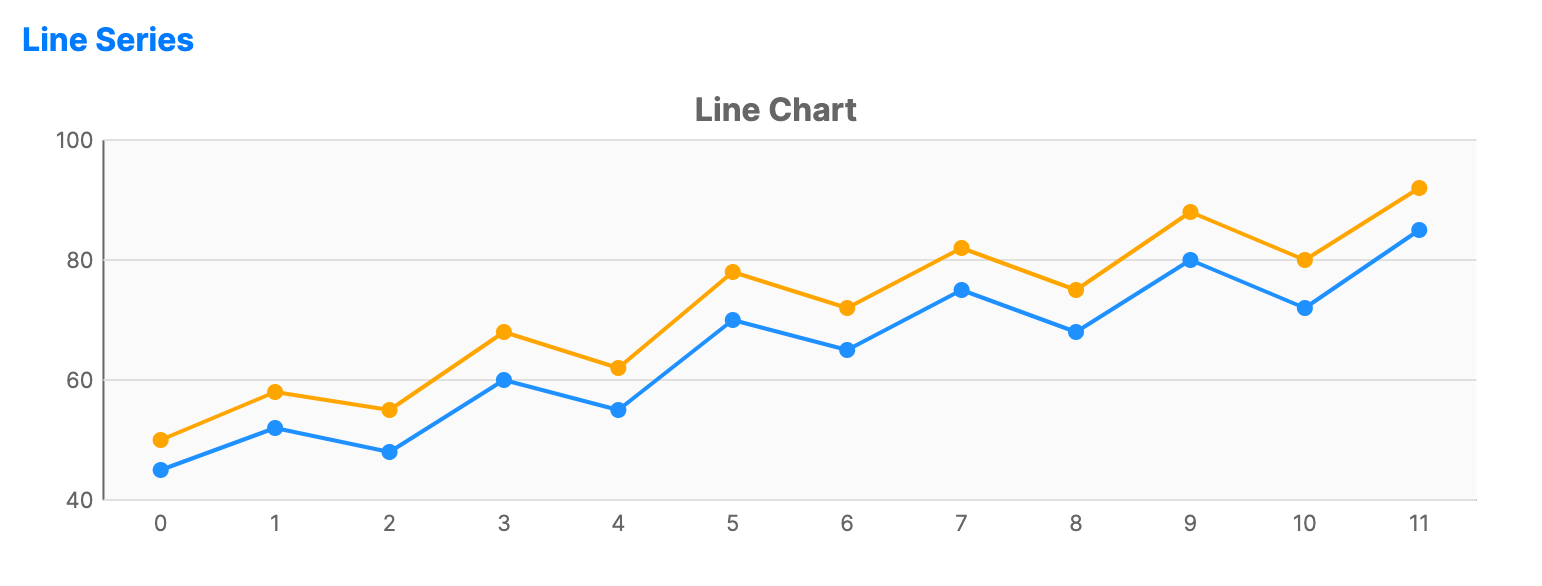
Every series type, rendered live from the same control you would ship. Pick a category, switch variants, and open the one you want in the docs.
WebAssembly demo
Try the Charts in your browser
Zoom and pan, candlesticks with indicators, stacked series, donuts, heatmaps and more, compiled to WebAssembly.
Setup
Simple installation and implementation.
Add the package, drop the control into your view, and bind it. There is no renderer to configure and no per-platform code to write.
Add the Charts package to your project
dotnet add package Avalonia.Controls.ChartsInclude your Avalonia UI license key in the executable project file .csproj
<ItemGroup>
    <AvaloniaUILicenseKey Include="YOUR_LICENSE_KEY" />
</ItemGroup>
Customer stories
"Avalonia has a very strong community, and frankly is a joy to work with."
Bill Henning
CEO & Founder, Actipro Software




Pro features
Charts is included with Pro.
One subscription carries all seven premium components, 70+ chart types and the advanced tooling. Nothing on this page is a separate purchase.
Included components
FAQ
Your questions,
answered.
Can't find what you need? We're here to help.
No. This component is part of the Avalonia Pro and Enterprise tiers. Activation requires an Avalonia account and a valid Pro or Enterprise licence.
Yes. Each component gives you a ready UI out of the box, but you can build a bespoke interface by using the underlying classes directly and wiring up your own commands and visuals.
Supported formats depend on the underlying platform. Check the component's documentation and the platform's own capability lists for specifics.
Avalonia UI components support Windows, macOS, Linux, iOS, Android, and WebAssembly. Each component uses the native platform back-end for optimal performance and compatibility.
Bring your data to life
Try Avalonia Charts free for 30 days and put 70+ chart types to work in your own app. One MVVM-ready API, rendered natively on every platform Avalonia supports.